Understanding Demography: Population Trends and Analysis

Demography is the study of population size, distribution, and composition, encompassing elements such as mortality, natality, migration, and demographic forces. Population census plays a crucial role in collecting and analyzing demographic data, with methods like De Jure and De Facto census. Inter-census estimates help in understanding population changes over time, while the concept of mid-year population provides insights into population dynamics. Explore the dynamics of population patterns and trends through the lens of demography.

Download Presentation

Please find below an Image/Link to download the presentation.
The content on the website is provided AS IS for your information and personal use only. It may not be sold, licensed, or shared on other websites without obtaining consent from the author. Download presentation by click this link. If you encounter any issues during the download, it is possible that the publisher has removed the file from their server.
E N D
Presentation Transcript
Learning objectives Define demography Describe the process of counting of the population State methods of estimation of the population size in inter-census years List and explain demographic elements List demographic forces and explain how it affects demographic elements Describe a given population using the population pyramid Define and distinguish between young and old dependency ratio
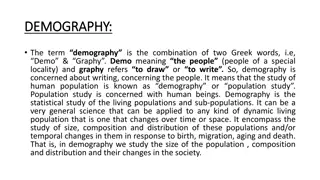
DEFINITION OF DEMOGRAPHY Demo = population graphy =measurement Demography is the science concerned with the study of and the changes taking place in population size, distribution and composition
Demographic elements Demographic forces Size (how many) Mortality Composition (characteristics) Natality Distribution (place of residence) Migration
Population census is enumeration of all persons of a country in a specified time collection of demographic & socioeconomic data analysis and publication of the data Usual timing of population census Census is carried every ten years at a time of minimal movement of the population (international and national travel)
De Jure Census Counting individuals at their legal permanent residence regardless of their physical presence. Gives a factual figure De Facto Census Counting individuals wherever they are on the census day. It is easier More economic Main disadvantages Expensive and time consuming People may be missed or counted twice in view of the definition of "permanent residence" for population of high mobility Main disadvantages Persons in transit may be missed False information of the population size of areas with high migration or high seasonal mobility
Inter-census estimate Population in inter-census years is estimated relying on actual population Use the preceding census population as starting point Adding the births and the immigrants Subtracting the deaths and the emigrants
Mid Year Population The population count is adjusted to represent the population as of July the 1st of the year The mid year population is used to compute indicators related to population
Uses of population census Provides information on the changes of population size Population size is needed to compute morbidity, mortality and fertility rate Related to health status of the population as it depends on the dynamic relationship between number of people, their characteristics and the space they occupy Planning of health services is guided by demographic variables as number of health units required, their distribution and the number of healthcare workers required for service delivery
Population (in millions) Population (in millions) Male Female Age in years
Population pyramid is a graphical presentation of the age and sex composition of the population represented by two histograms (one for male and the second for female) of the age distribution of the population set at 5-year interval and placed back to back
Apex= People living to old age People 60 years= Old dependency Height= life span Median age People < 15 years= Young dependency Base= births
Halves -Proportion of males and females Base -Births; population adding to itself -Wide base reflects high births -Narrow base reflects low births Apex -Oldest people; reflects those living old age -Tapering apex reflects few living to old age -Broad apex reflects many living to old age Height -Life span; increase height reflects increase life span Side -Change in population size due to death or migration -Steep slope reflects rapid decrease -Almost straight side reflects slow decrease
Less than 15 -Represents the size of people below 15 years -Represents the size of dependent youth -Large size in rapidly growing population -Small size in slowly growing population 60 + years -Represents the size of people 60 years -Represents the size of dependent old -Large size in population with longer life span -Small size in population with short life span Median age -Age that divide the population into two halves -Small in population with high births -Large in population with low births
Dependency ratio reflects the proportion of those who depends on the working group (15 to less than 60 years) ?????????? <15 ????? ?????????? 15 ??<60 ??????100 Young dependency ratio = ?????????? 60????? ?????????? 15 ??<60 ??????100 Old dependency ratio = Total dependency ratio = ?????????? <15 ????? & 60 ????? ?100 ?????????? 15 ??<60 ?????
Population CBR TFR Growth rate CDR Life expectancy 27 752 000 19 per 1000 population 2.1 per woman 1.5% 3 per 1000 population 75 years Population CBR TFR Growth rate CDR Life expectancy 25 732 000 19 per 1000 population 2.4 per woman 1.5% 3 per 1000 population 74 years
Population CBR TFR Growth rate CDR Life expectancy 31 877 000 17 per 1000 population 2 per woman 1.3% 4 per 1000 population 77 years Population CBR TFR Growth rate CDR Life expectancy 40 251 000 13 per 1000 population 2 per woman 0.7% 6 per 1000 population 81 years
Growth% 7.00% 6.00% 5.00% 4.00% 3.00% 2.00% 1.00% 0.00% 1960 1965 1970 1975 1980 1985 1990 1995 2000 2005 2010 2015 2020 Years Population growth in KSA 1960 - 2015
Total population 27 752 316 Male population Female population Sex ratio (M/F) 15 105 575 12 646 741 119.4/100 Below 15 years 15 to < 60 years 60 years 7 512 186 18 802 626 1 437 504 Young dependency ratio Old dependency ratio Total dependency 39.95% 7.64% 47.59%


")