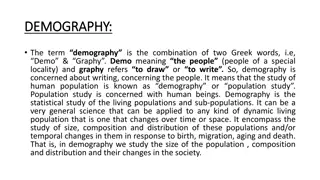
Understanding Demography and Population Dynamics

Demography

Objectives
•
Defining demography
•
What forces are affecting the demography of a population
•
For a country status to be changed from developing to a developed
country; What are the stages it has to pass through?
Definition of demography
•
Is the scientific study of a human population.
•
It focuses on three phenomenon:
•
Changes in population size.
•
The composition of the population
•
The distribution of the population
Demographic forces
(determinants of population change)
•
Mortality
•
Fertility
•
Migration
Mortality rate
•
is the number of deaths in a particular population per unit of time.
•
Average risk of dying of a person in the group during a span of time.
Fertility rate
•
It is the average number of children born to women during their
reproductive years.
•
For the population in a given area to remain stable, an overall total
fertility rate of 2.1 is needed, assuming no immigration or emigration
occurs.
Examples
•
http://worldpopulationreview.com/countries/birth-rate-by-country/
•
http://worldpopulationreview.com/countries/death-rate-by-country/
•
http://worldpopulationreview.com/countries/saudi-arabia-
population/
Demographic cycle
•
Also known as demographic transition
•
Some countries have passed through high fertility and high mortality
conditions to a low fertility and low mortality conditions, both aiming
at low growth of population. These two conditions have been
referred to as the “old and new balance” with an in between period
of imbalance.
Demographic cycle
•
FIRST STAGE
•
It is high stationary stage, characterized by balance of high birth rate and high
death rate
•
Pre Modern times. It was true for all human populations up until the late 18
th
.
C. when the balance was broken in western Europe.
Demographic cycle
•
SECOND STAGE (Early expanding)
•
Death rate < Birth rate (unchanged or increased in some)
•
The decline in death rate started to be observed in Europe in the late 18
th
C.
•
Many country in South Asia and Africa in this stage
Demographic cycle
•
THIRD STAGE (Late expanding)
•
The death rate declines further and the birth rate tends to fall
•
e.g. India, China, Singapore
Demographic cycle
•
FOURTH STAGE (Low stationary)
•
Low birth rate and low death rate
•
Zero population growth or close to zero
•
Most industrialized countries
Demographic cycle
•
FIFTH STAGE (Declining)
•
Population starts to shrink because birth rate is declining further and
becoming lower than death rate
•
e.g. East Europe
•
http://worldpopulationreview.com/
Population Growth
(Population Growth= Natural Increase + Net Migration)
•
The equation can also be expressed in terms of
rates
.(by dividing each
element by the mid year population expressed per 1000).
•
Population Growth rate however is usually expressed in
percentage
which helps us calculate the rate at which the population of a country or
a community is growing.
•
The principle of compound growth rate is applied to calculate the effects
of population growth rate on
future population
.
Population Growth
•
A population growing at the rate of 01 % per year, How many years it will
take for this population to double?
1.
100 years
2.
70 years
3.
50 years
•
It is estimated that the Saudi Population in 2018 is around 33.55 million.
How long it will take for this population to double at growth rate of
1.87% per year?
Population Pyramids
•
Objectives:
•
Definition
•
How to read a population pyramid
•
Knowing the different shapes of population pyramids
•
Importance of population pyramids
P
o
p
u
l
a
t
i
o
n
P
y
r
a
m
i
d
•
Is a graphical
illustration that shows
the distribution of
various age groups by
sex in a population.
•
Halves
- Males : Females
•
Base
-Births; population adding to itself
-Wide base reflects high births
-Narrow base reflects low births
•
Apex
-Oldest people; reflects those living old age
-Tapering apex reflects few living to old age
-Broad apex reflects many living to old age
•
Height
-Life span; increase height reflects increase life span
•
Side
-Change in population size due to death or migration
•
Less than 15
-Represents the size of dependent youth < 15
-Large size in rapidly growing population
-Small size in slowly growing population
•
60 + years
-Represents the size of dependent old ≥ 60
-Large size in population with longer life span
-Small size in population with short life span
•
Median age
-Age that divide the population into two halves
-Small in population with high births
-Large in population with low births
Base= births
Height= life span
Apex= People living to old age
Side= mortality and migration
People < 15 years=
Young dependency
People ≥ 60 years=
Old dependency
Median age
Types of population Pyramid
•
Expanding population pyramid
•
Stationary population pyramid
•
Constrictive population pyramid
Expansive
•
Expansive or expanding
pyramid usually presents
itself in the form of
triangular shape with
concaved edges
•
High population growth
due to:
•
High birth rate
•
Shorter life expectancy
(high death rate)
•
Usually associated with
lower standard of living
Stationary
•
It is showing
unchanging pattern
of fertility and mortality
•
Age groups almost
equal, but it is expected
to see smaller figures at
the oldest age groups
Constrictive
•
Narrow base
•
Apex wider
•
It is more common when
immigrants are factored out
•
Indicated:
•
High level of education
•
Use of birth control
•
Good health care
system
Importance of population Pyramid
•
It gives valuable information for human resource planners
•
Wide base vs. Narrow base, what to do?
•
If proportion of old age population is high, what to do?
•
Market researchers
•
Product developers
•
The importance comes from what it tells us. e.g:
https://quizlet.com/121200998/the-importance-of-population-pyramids-
and-resources-flash-cards
Thank You
Demography is the scientific study of human population focusing on changes in size, composition, and distribution. Forces such as mortality, fertility, and migration impact population changes. The transition from a developing to a developed country involves passing through various stages with different demographic characteristics. Examples and explanations of demographic forces and cycles provide insights into population dynamics.

Download Presentation

Please find below an Image/Link to download the presentation.
The content on the website is provided AS IS for your information and personal use only. It may not be sold, licensed, or shared on other websites without obtaining consent from the author. Download presentation by click this link. If you encounter any issues during the download, it is possible that the publisher has removed the file from their server.
E N D
Presentation Transcript
Objectives Defining demography What forces are affecting the demography of a population For a country status to be changed from developing to a developed country; What are the stages it has to pass through?
Definition of demography Is the scientific study of a human population. It focuses on three phenomenon: Changes in population size. The composition of the population The distribution of the population
Demographic forces (determinants of population change) Mortality Fertility Migration
Mortality rate is the number of deaths in a particular population per unit of time. Average risk of dying of a person in the group during a span of time.
Fertility rate It is the average number of children born to women during their reproductive years. For the population in a given area to remain stable, an overall total fertility rate of 2.1 is needed, assuming no immigration or emigration occurs.
Examples http://worldpopulationreview.com/countries/birth-rate-by-country/ http://worldpopulationreview.com/countries/death-rate-by-country/ http://worldpopulationreview.com/countries/saudi-arabia- population/
Demographic cycle Also known as demographic transition Some countries have passed through high fertility and high mortality conditions to a low fertility and low mortality conditions, both aiming at low growth of population. These two conditions have been referred to as the old and new balance with an in between period of imbalance.
Demographic cycle FIRST STAGE It is high stationary stage, characterized by balance of high birth rate and high death rate Pre Modern times. It was true for all human populations up until the late 18th. C. when the balance was broken in western Europe.
Demographic cycle SECOND STAGE (Early expanding) Death rate < Birth rate (unchanged or increased in some) The decline in death rate started to be observed in Europe in the late 18thC. Many country in South Asia and Africa in this stage
Demographic cycle THIRD STAGE (Late expanding) The death rate declines further and the birth rate tends to fall e.g. India, China, Singapore
Demographic cycle FOURTH STAGE (Low stationary) Low birth rate and low death rate Zero population growth or close to zero Most industrialized countries
Demographic cycle FIFTH STAGE (Declining) Population starts to shrink because birth rate is declining further and becoming lower than death rate e.g. East Europe http://worldpopulationreview.com/
Relation between growth rate and population Annual rate of growth % Rating # of years required for the population to double in size Stationary population Slow growth Moderate growth Rapid growth Very rapid growth Explosive growth No growth Less than 0.5 0.5 to 1.0 1.0 to 1.5 1.5 to 2.0 2.0 to 2.5 2.5 to 3.0 3.0 to 3.5 3.5 to 4.0 More than 139 139 - 70 70 - 47 47 - 35 35 - 28 28 - 23 23 - 20 20 - 18
Population Growth (Population Growth= Natural Increase + Net Migration) The equation can also be expressed in terms of rates.(by dividing each element by the mid year population expressed per 1000). Population Growth rate however is usually expressed in percentage which helps us calculate the rate at which the population of a country or a community is growing. The principle of compound growth rate is applied to calculate the effects of population growth rate on future population .
Population Growth A population growing at the rate of 01 % per year, How many years it will take for this population to double? 1. 2. 3. 100 years 70 years 50 years It is estimated that the Saudi Population in 2018 is around 33.55 million. How long it will take for this population to double at growth rate of 1.87% per year?
Population Pyramids Objectives: Definition How to read a population pyramid Knowing the different shapes of population pyramids Importance of population pyramids
Population Pyramid Population Pyramid Is a graphical illustration that shows the distribution of various age groups by sex in a population.
Halves - Males : Females Base -Births; population adding to itself -Wide base reflects high births -Narrow base reflects low births Apex -Oldest people; reflects those living old age -Tapering apex reflects few living to old age -Broad apex reflects many living to old age Height -Life span; increase height reflects increase life span Side -Change in population size due to death or migration
Less than 15 -Represents the size of dependent youth < 15 -Large size in rapidly growing population -Small size in slowly growing population 60 + years -Represents the size of dependent old 60 -Large size in population with longer life span -Small size in population with short life span Median age -Age that divide the population into two halves -Small in population with high births -Large in population with low births
Apex= People living to old age People 60 years= Old dependency Height= life span Median age People < 15 years= Young dependency Base= births
Types of population Pyramid Expanding population pyramid Stationary population pyramid Constrictive population pyramid
Expansive Expansive or expanding pyramid usually presents itself in the form of triangular shape with concaved edges High population growth due to: High birth rate Shorter life expectancy (high death rate) Usually associated with lower standard of living
Stationary It is showing unchanging pattern of fertility and mortality Age groups almost equal, but it is expected to see smaller figures at the oldest age groups
Constrictive Narrow base Apex wider It is more common when immigrants are factored out Indicated: High level of education Use of birth control Good health care system
Importance of population Pyramid It gives valuable information for human resource planners Wide base vs. Narrow base, what to do? If proportion of old age population is high, what to do? Market researchers Product developers The importance comes from what it tells us. e.g: https://quizlet.com/121200998/the-importance-of-population-pyramids- and-resources-flash-cards