Understanding Mark-Recapture Methods for Estimating Population Abundance

This content explores the concept of estimating population abundance using mark-recapture methods. It covers various aspects such as natural mortality, recruitment, fishing mortality, immigration, and emigration. The process involves marking animals in one sample, allowing them to integrate back into the population, and then capturing marked and unmarked animals in a subsequent sample. Different approaches, including batch marking and individual marking, are discussed, each with its own advantages and limitations. The method allows for estimating mortality, survival, recruitment, and movement within a population.

Download Presentation

Please find below an Image/Link to download the presentation.
The content on the website is provided AS IS for your information and personal use only. It may not be sold, licensed, or shared on other websites without obtaining consent from the author. Download presentation by click this link. If you encounter any issues during the download, it is possible that the publisher has removed the file from their server.
E N D
Presentation Transcript
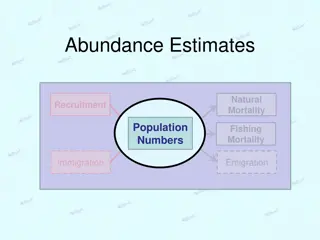
Abundance Estimates Natural Mortality Recruitment Population Numbers Fishing Mortality Immigration Emigration
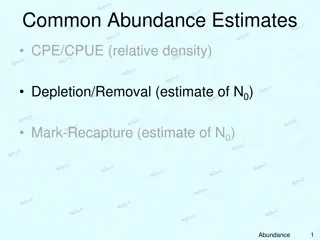
Common Abundance Estimates CPE/CPUE (relative density) Depletion/Removal (estimate of N0) Mark-Recapture (estimate of N0) 2 Abundance
Overall Concept In a closed population, population abundance can be estimated by marking animals collected in one sample, allowing them to mix back into the population, and then capturing marked and unmarked animals in a second sample. 3
Mark-Recapture Methods Marking/Tagging Batch Cheaper, but has limitations 4 Abundance
Mark-Recapture Methods Marking/Tagging Batch Cheaper, but has limitations Individual Expensive, but also allows estimates of mortality / survival, recruitment, movement 9 Abundance
Marking Fish 10
Marking Fish 11
Marking Fish 12
Marking Fish 13
Marking Fish 14
Mark-Recapture Methods Marking/Tagging Batch Cheaper, but has limitations Individual Expensive, but also allows estimates of mortality / survival, recruitment, movement Recapture information recorded in capture history format. 15 Abundance
Capture History Format A matrix As many columns as capture events As many rows as uniquely caught fish Each cell contains a 1 if the fish was caught in that event and a 0 if it was not 16 Abundance
Capture History Example #1 Suppose that a researcher captured and individually marked 75 fish on day 1. Two days later, a total of 100 fish were captured of which 25 were marked. How many columns? Rows? What does a row look like for a fish Captured in both samples Captured in the first but not the second sample Captured in the second but not the first sample Captured in neither sample 17 Abundance
Abundance Estimates Natural Mortality Recruitment Population Numbers Fishing Mortality Immigration Emigration
Overall Concept In a closed population, population abundance can be estimated by marking animals collected in one sample, allowing them to mix back into the population, and then capturing marked and unmarked animals in a second sample. 19
Overall Concept Marking run Recapture run 20
Capture Data Summary Second Sample Not Captured Total Captured First Not Captured Sample Captured m M n Total N Definitions M = number marked in population n = size of recapture sample m = number marked in recap sample N = population size 21
Parameter / Statistics Definitions n=19 m=7 M=16 N=50 Marking run N=50 Recapture run 22
Estimation Concept The proportion of marked fish in the recapture sample is equal to the proportion of marked fish in the population. Which can be immediately rewritten as 23
Estimation Example n=19 m=7 M=16 M*n/m = 16*19/7 = 43.43 N=50 N=50 Marking run Recapture run 24
Method Name Petersen C.G.J. Petersen Danish fisheries biologist Publication from 1896 Lincoln F. C. Lincoln Worked for U. S. Fish and Wildlife Service Publication from 1930 Thus, Lincoln-Petersen method 25
Lincoln-Petersen is Biased Init Pop (500) Mean Pop Est 500 1000 1500 Population Estimate 26
Chapman Modification Chapman proposed a simple modification to the Petersen method Bias is negligible if m>7 27
Chapman Modification is Unbiased Init Pop (500) Mean Pop Est 500 1000 1500 Population Estimate 28
Estimation Confidence Intervals Seber (1982) suggests using the binomial distribution of m/n > 0.10 the normal approximation if m > 50 the Poisson approximation otherwise 29 Abundance