Population Growth in India: Challenges and Implications
Overpopulation is a pressing issue globally, with India being the 2nd most populous country. The rapid population growth is linked to challenges such as poverty and hindered development. Concepts like population explosion and demographic transition shed light on the dynamics. India's population growth rate, demographics, and comparisons with other countries highlight the complexity of the situation.
Download Presentation

Please find below an Image/Link to download the presentation.
The content on the website is provided AS IS for your information and personal use only. It may not be sold, licensed, or shared on other websites without obtaining consent from the author. Download presentation by click this link. If you encounter any issues during the download, it is possible that the publisher has removed the file from their server.
E N D
Presentation Transcript
POPULATION GROWTH IN INDIA DONE BY : SK SAFIKUL HAQUE, GEOGRAPHY, KHARAGPUR COLLEGE.
INTRODUCTION Overpopulation is a growing problem throughout the world. World s population has reached 7 billion. There will, of course, be significant increases in the demand for food, water, and energy in developing countries. Rapid population growth impedes development.
India and many third world countries are now passing through the phase of population explosion. It is being argued that this situation has arisen because development countries has failed to maintain pace with populationgrowth. in these Rapid growth of population causes poverty and proves to be a barrier to development.
Concepts & Definitions Population: The population of an area is the total number of all individuals alive in a particular point in time. Thomas Frejka, (1973) Population explosion: The Theory of Demographic Transition, asserts that the population explosion implying a sudden spurt in the rate of population growth is a transitory phenomena that occurs in the second stage of demographic transition due to rapid fall in mortality rate without a corresponding fall in the birth rate. Birth Rate is the total number of births per 1000 of a population eachyear. Mortality rate is the total number of deaths per 1000 individuals per year. Total fertility rate (TFR) is the average number of children that would be born to a woman over her lifetime.
Population growth in India India is the 2nd most populous country in the world, with over 1.21 billionpeople (2011 census) India already containing 17.5% of the world's population and projected to bethe world's most populous country by 2025, surpassingChina. Population growth rate is 1.5%, ranking 90th in theworld. (Qatar ranks 1st with a rate4.93%) India has more than 50% of its population below the age of 25 and more than 65% below the age of 35. It is expected that, in 2020, the average age of an Indian will be 29 years, compared to 37 for China and 48 for Japan.
Contd.. Uttar Pradesh is the most populous state in the country with almost 200 million people, which is more than the population of Brazil. The combined Maharashtra (2ndmost populous State), at 312 million, is substantially greater than the population of USA. population of Uttar Pradesh and
Population & its growth in India: 1901-2011 Census year population Decadalgrowth Avg. annual exp.growth rate(%) - 0.56 -0.03 1.04 1.33 1.25 1.96 2.20 Progressive growth rate over 1901(%) - 5.75 5.42 17.02 33.67 51.47 84.25 129.94 absolute percent 1901 1911 1921 1931 1941 1951 1961 1971 23,83,96,327 25,20,93,390 25,13,21,213 27,89,77,238 31,86,60,580 36,10,88,090 43,92,34,771 54,81,59,652 - 1,36,97,063 -7,72,177 2,76,56,025 3,96,83342 4,24,27,510 7,81,46,681 10,89,24,881 5.75 (0.31) 11.00 14.22 13.31 21.64 24.80 1981 68,33,29,097 13,51,69,445 24.66 2.22 186.64 1991 84,64,21,039 16,30,91,942 23.87 2.16 255.05 2001 1,02,87,37,436 18,23,16,397 21.54 1.97 331.52 2011 1,21,01,93,422 18,14,55,986 17.64 1.64 407.64 Sources: Population Reference Bureau, Transition in world population, http:// www.prb.org/Publications/ Population Bulletins/2004/ sinWorldPopulationPDF249KB. aspx, pp 4
Percentage decadal population growth rate in India: 1951-1961 to 2001-2011 30 24.8 24.66 23.87 25 21.64 21.54 20 17.64 15 10 5 0 1951-91 1961-71 1971-81 1981-91 1991-01 2001-2011
Rural & urban population in India Source: Census,GOI
Population share of state & UT, India 2011 Sources: Census,GOI,2011
Population of Indian States Compared to a Few Countries in the World (in million) State Population Country Population UttarPradesh 200 Brazil 194 Maharashtra 112 Japan 128 Bihar 104 Mexico 107 WestBengal 91 Philippines 92 Vs Andhra Pradesh 85 Germany 82 Madhya Pradesh 73 Turkey 75 Tamil Nadu 72 Iran 73 Rajasthan 69 Thailand 68 Karnataka 61 UK 62 Gujarat 60 Italy 60 Sources: Census GOI/World Bank
Density of Population Density of Population is defined as the number of persons per square kilometer. With a population density of 382/km2,India ranks 31st among the most densely populated countries in the world. (Singapore ranks 1st-7301/km2) Even though India accounts for only 2.4% of surface area of the earth, it contributes 17.5% to the world population, which is extremely large. Where as USA, accounting for 7.2% of the earth s surface area, contributes only 4.5% to the world population.
Top Ten Most Densely Populated States of India Population Density (per squarekm) 1,102 1,029 859 689 573 555 550 442 397 394 S.No. States 1 2 3 4 5 6 7 8 9 10 Bihar West Bengal Kerala Uttar Pradesh Haryana Tamil Nadu Punjab Jharkhand Assam Goa Source: Family Welfare Statistics in India - 2011 & CensusIndia.gov Arunachal Pradesh and Andaman & Nicobar Islands havethe lowest population densities among the Indian states and union territories respectively.
Population Density of India in a chronological order Density of population per sq km 77 82 81 90 103 117 142 177 216 274 324 382 Source: Family Welfare Statistics in India - 2011 & CensusIndia.gov Year 1901 1911 1921 1931 1941 1951 1961 1971 1981 1991 2001 2011
Sex wise composition of population in India Sex ratio: No. of females per thousand males. All time lowest sex ratio was 927 in 1991. The sex ratio of India has shown improvement during last two decades. Sex ratio, as per the recent census is 940 which is largely comparable to the best performance (941 in 1961) in last fifty years.
Causes of rapid population Growth 1. High birthrate 2. Relatively lower death rate and 3. Migration Net Migration is the difference between emigration& immigration Emigration is when a person moves out of the country. Immigration is when a person moves into a country.
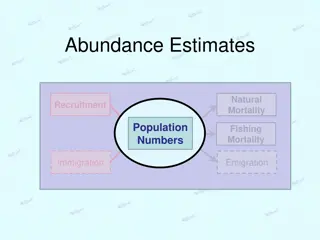
Interaction Population growth = (Birth rate+ Immigration) - (Mortality + Emigration) In India the population has rapidly increased mainly due to decline in the death rate, while the birth rate remained high.
Reasons for High Birth Rate A. Economicfactors B. Socialfactors A. Economic factors 1. Predominance of agriculture In agrarian society considered as economicburden. children never been 2. Slow urbanization process& predominance of villages 3. Poverty People are not poor because they have large families. Quite the contrary, they have large families because theyarepoor. -(MahmoodMandani)
B. Social factors 1. Near universality of marriage Presently in India by the age of 50, only 5out of 1000 Indian women remain unmarried. 2. Lower age at the time of marriage 3. Religious & social superstitions Belief that it is a must to have a son, because according to religion certain rites can be performed only by him & noneelse. 4. Joint family system The joint family system induces the young couple to have children, though theymay not be in a position to supportthem.
Contd.. 5. Lack of education 6. Unawareness aboutfamily planning services 7. Social and religious beliefs - especially in relation to contraception and abortion 8. Infant Mortality Rate
Reasons for decline in the mortality rate a. Elimination of famines b. Control of epidemics & decline in the incidence of Malaria & Tuberculosis Cholera and small fox were the two major causes of epidemics before independence. Now cholera is completely eradicated and small foxis very much under control. c. Supply of pure drinking water d. Sanitation & hygiene
Contd.. e. Nutrition levels f.Living standard Education, care medical facilities health g. & expanded h. Social factorssuch as conflicts and levels of violent crimes
Birth rate & Death rate in India Birth rate (births/1,000population) Death rate (deaths/1,000population) Year 1941-51 39.9 27.4 1951-61 41.7 22.8 1961-71 41.1 19 1971-81 37.2 15 1981-91 29.5 9.8 1991-01 25.8 8.5 2001-11 22.5 7.7 Source:Calculatedfromthe CensusofIndia dataandMinistry ofHealth andFamilyWelfare, Government ofIndia
Birth rate & Death rate in India 45 40 35 rate of growth 30 25 20 15 10 5 0 1941-51 1951-61 1961-71 1971-81 years 1981-91 1991-01 2001-11 Birth rate (births/1,000 population) Death rate (deaths/1,000population)
Migration: geographical distribution International Migration from low to middle & high income countries Employment migration based Intra-national Rural to Urban Semi-Urban to Urban Why migrate? Lure of big city Job opportunities (pull factor) Lack of rural opportunities (push
International migration, 2010 (Top 10) Highest percentage of international migrants Largest number ofinternational migrants, (millions) Qatar 87% USA 42.8 UAE 70% Russia 12.3 Kuwait 69% Germany 10.8 Jordan 465 Saudi Arabia 7.3 Palestine 44% Canada 7.2 Singapore 41% France 6.7 Israel 40% UK 6.5 HongKong 39% Spain 6.4 Saudi Arabia 38% India 5.4 Oman 38% Ukraine 5.3 Source: Population Growth & Its impacts, PAD 6838/ 7865 Lecture 3
Population pyramid of developing & developed countries
Youth Bulge Population pyramid depicts the current distribution of people across age groups. A large number of youth constitute India s population; about 36 percent of the population is under age15. This young age structure creates a powerful momentum for future population growth. Many females will soon enter their reproductive years and have children within the next decade. Even if fertility declines rapidly, it will take 50 years for the population tostabilize.
Indias Youth Bulge Projections arrived using Spectrum with inputs from Census 2001, and NFHS
How to reduce rapid population growth? 1.Expansion of industrial sector: Industrial workers are aware of difficulties in getting the employment & are interested in restricting the size of their family. 2.Creation of employment opportunities in urban areas: The housing problem and the cost of upbringing of children in urban areas are the two factors which usually deter people from having big families
3. Equitable distribution of income and removal of poverty Poor people have virtually no interest in limiting the size of the family. 4. Increase education, employmentand wages for women Education often changes the attitude of a person towards family, marriage and the number of children he/she should have.
5. Increase the minimum-age child labor 6.Provide better old-age social security To reduce the dependency on the children 7.Raising the minimum age of marriage India should try to draw some lesson from the experiences of China, Malaysia and Sri Lanka where fertility decline has occurred largely through an increase in age at marriage.
8. Improve child health to reduce infant mortality 9. Implementation of family- planning programs 10. Monetary subsidies to small families
Population Policy in India It is difficult to decide as what is optimum size of population for India underthe existingconditions. There has been complete reliance on family planning in order toreduce populationexplosion. The national family planning program was launched in 1951, and was the world's first governmental population stabilizationprogram. Low female literacy levels and the lack of widespread availability ofbirth-control methods is hampering the use of contraception inIndia. Family planning accepted & practiced effectively in some of the states inIndia. Education and awareness needed about FamilyPlanning.
CITATION 1. https://www.slideshare.net/sharathanda/population-growth-and-economic- development-in-india?qid=c148573e-98d6-4959-b4c5- 48d3716d4554&v=&b=&from_search=1 2. https://www.slideshare.net/b4anuj/population-of-india-presentation 3. https://en.wikipedia.org/wiki/Demographics_of_India 4. https://www.google.com/search?q=population+distribution+in+india&hl=en&sxsr f=ALeKk03INBlpuVj7OWLcKd8VEfaS6Pg7tg:1599488491499&source=lnms&tbm=is ch&sa=X&ved=2ahUKEwinpu76ntfrAhU8wjgGHf_pB0UQ_AUoAnoECA8QBA&biw= 1344&bih=712 5. https://www.toppr.com/guides/geography/population/population-of-india/ 6. https://www.toppr.com/guides/geography/population/population-of-india/


