Understanding Population Ecology and Growth Patterns
 undefined


Define the following ecological terms: Population, population density,
community, population distribution, diversity, Limiting factors, resources,
biotic potential (
r ),
carrying capacity
( K ),
Survivorship
.
Also, Exponential Growth vs. Logistic Growth and the corresponding curves on
a graph.
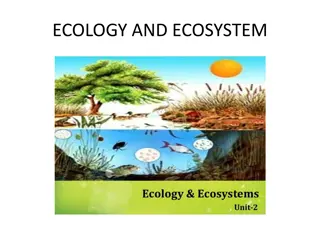
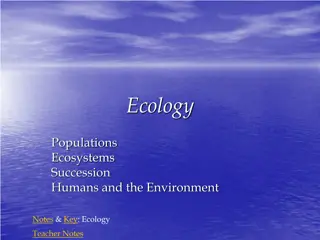
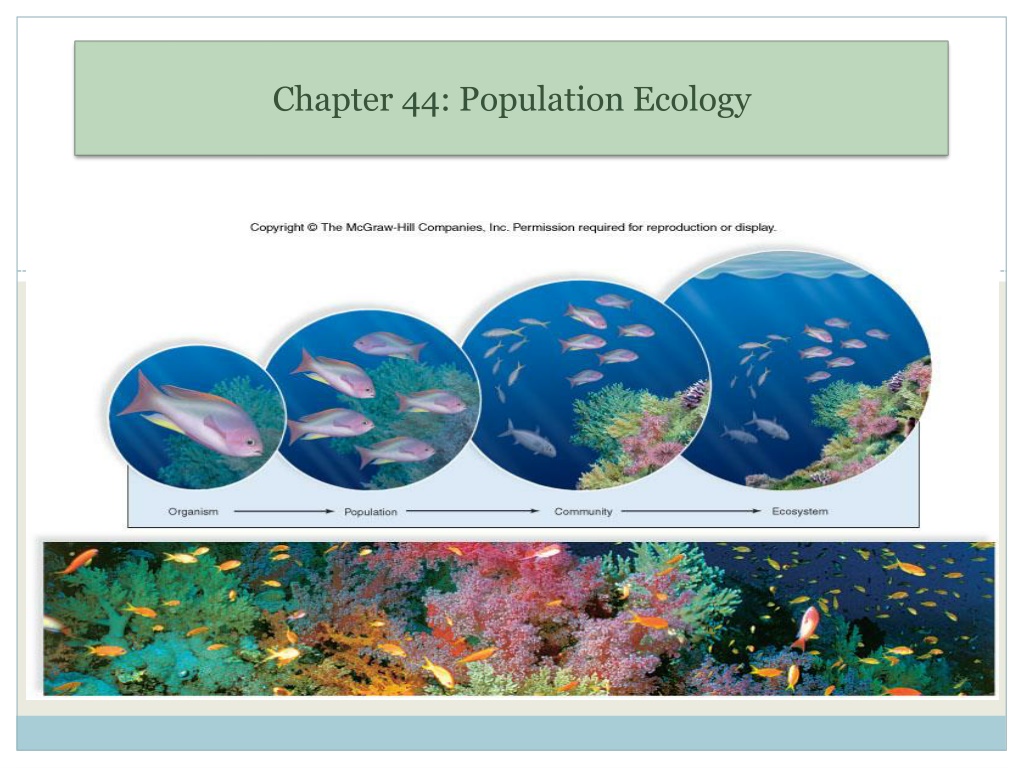
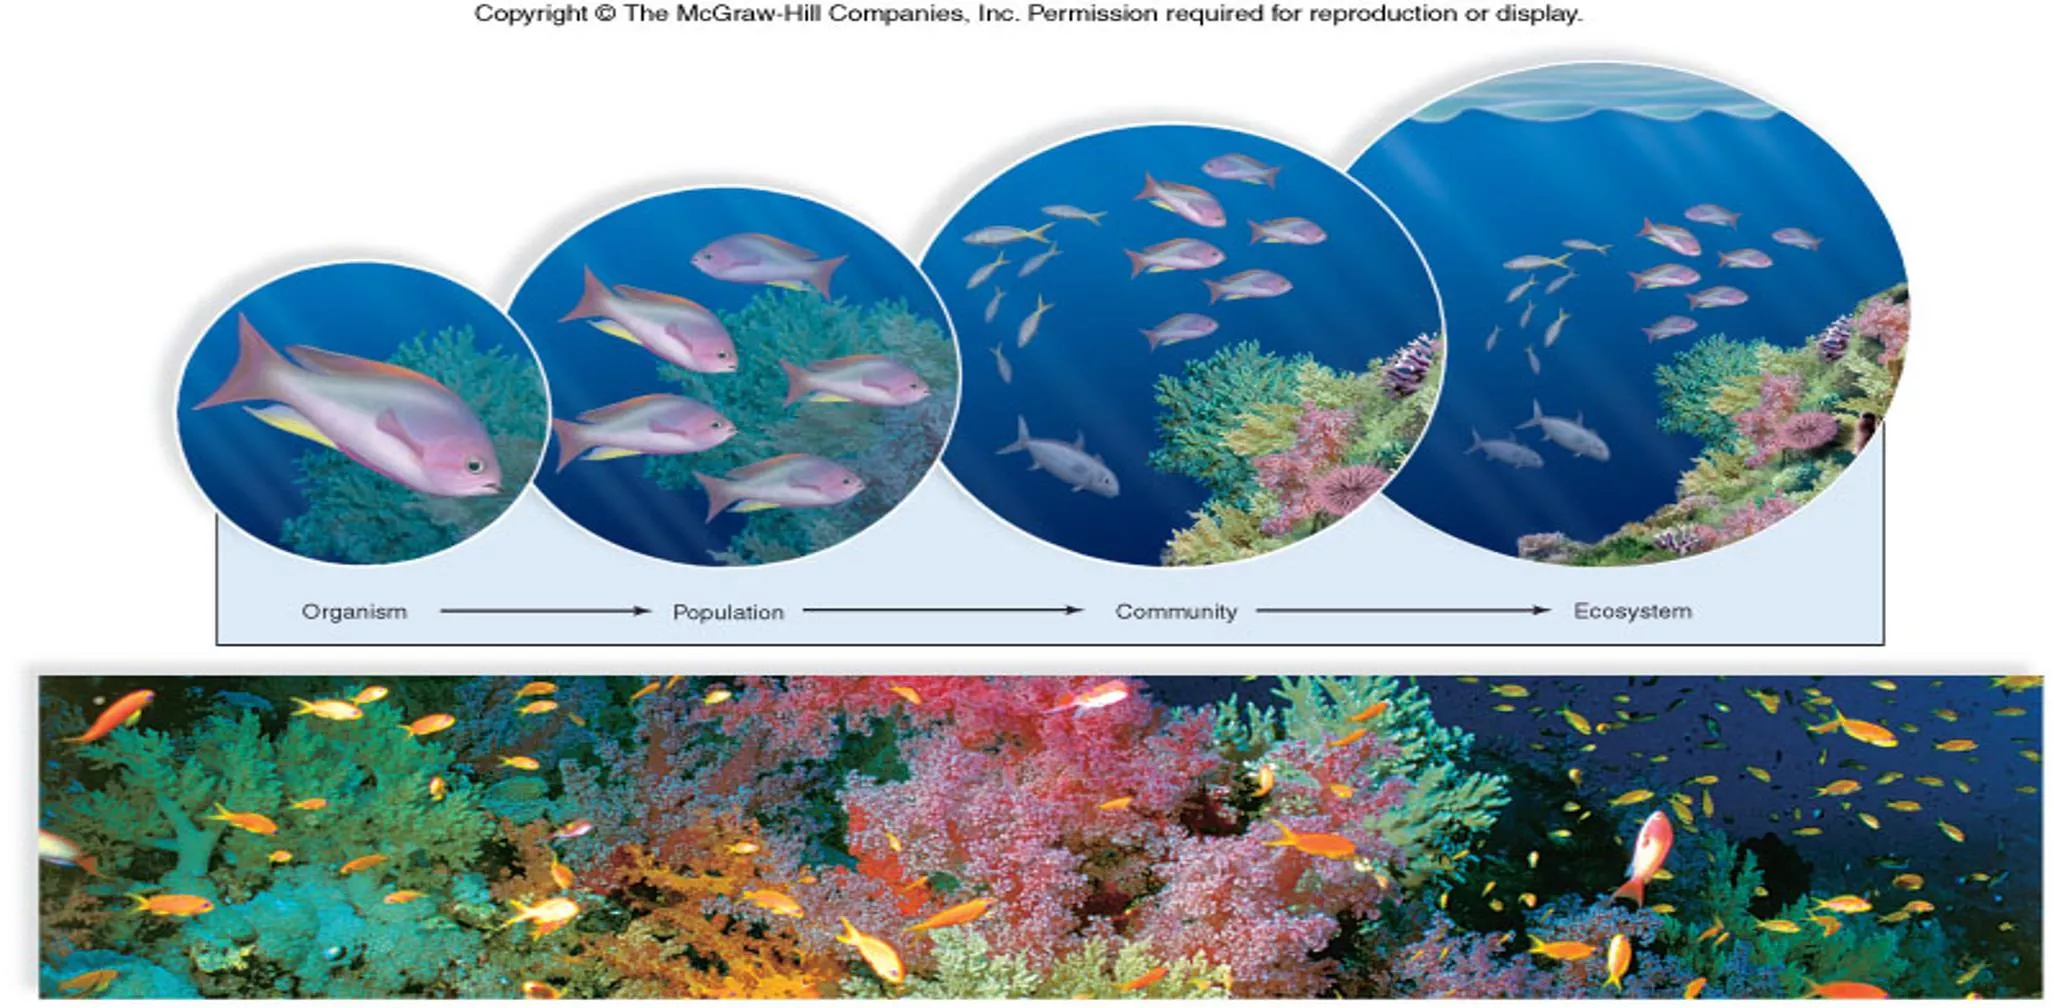
44.1 Scope of Ecology
Ernst Haeckel, 1866 Ecology: the study of the interactions among all
organisms and with their physical environment.
Ecology , as a study, has many levels:
Habitat
Population
Community
Ecosystem
Biosphere
A central goal of modern ecology is to develop models that explain and predict the
distribution and abundance of organisms.
The Scope of Ecology
44. 2 Demographics of Populations
Demography
:
the statistical study of a population, such as its density, distribution and
rate of growth.
Population density
: the number of individuals per unit of area ( example 73 / sq. mi in
USA)
Resources
: the abiotic (non living) and biotic (living) components of an environment.
water, shelter, food, mates, space etc.
Limiting Factors
: are those environmental aspects that particularly determine where an
organism lives.
- sometimes are the maximum tolerance of certain environmental conditions that
an organism can live in.
Example: Fish in water at different temps and oxygen levels
Patterns of Distribution
Three main observed types:
Clumped
Random
Uniform
However patterns are also relative to
scale!!
Kangaroos may seem clumped if you look
at a global scale ( they are all grouped in
Australia)
Also, distribution patterns do not have to
remain constant but can change with the
organisms stage of life.
Population Growth
Rate of natural increase (
r
)
: “growth rate” which is dependent on the number of
individuals born each year and the number of individuals that die each year.
Example: 30 births -10 deaths / 1000 = .02 = 2.0 %
Biotic Potential
:the highest possible rate of natural increase when resources are unlimited.
Biotic Potential depends on certain characteristics:
Usual number of offspring per reproductive event
Chances of survival until age of reproduction
How often each individual reproduces
Age at which reproduction begins
Mortality patterns
Cohort:
all the members of a population born at the same time. Cohorts are used to create
life table.
Population Growth
Survivorship Curves:
Type I
Type II
Type III
Survivorship Curves
Survivorship :
the
probability of newborn
individuals of a cohort
surviving to particular
ages
Survivorship Curves:
Type I
Type II
Type III
44. 3 Population Growth Models
Semelparity
:
members of the population have only a single reproductive event in their lifetime.
Characteristics
at reproductive time, mature adults stop growing
all energy is directed (and used) for reproduction
adults die after reproducing
this is adaptive to unstable environments
Iteroparity
: members of the population experience many reproductive events throughout lifetime.
Characteristics:
continue to invest energy into continued survival
this increases their chances of reproducing again
It is important to know that not all reproduction fits these two models but most will.
The two models of population growth have characteristic graphs
Exponential and Logistic Growth
A species model of population growth can
be used to predict the future population
growth.
Semelparous species often exhibit
Exponential Growth ( seen as a J curve).
Exponential Growth
= number of
individuals added each generation
increases as the total number of females
increases.
The J curve has two phases:
Lag phase
Exponential growth phase
R= 2.4*
R is used for discreet breeding
events instead of r
Exponential and Logistic Growth
Logistic Growth
(sigmoidial curve or S curve)
Lag phase
Exponential growth phase
Deceleration Phase
Stable equilibrium phase.
This is seen when the environmental
factors oppose growth
Carrying Capacity
(K) : the maximum
number of individuals of a given species
the environment can support.
Exponential growth and Logistic growth curves both can be used to indicate what
management strategies to use.
If you want to keep birth rates high then keep a population small enough to stay
in exponential growth so that biotic potential can have full effect (fish farm for
food)
If you want to keep a population limited (such as a crop pest), then do things in
the environment that will reduce the carrying capacity ( instead of reducing
population which brings you back to exponential growth)
44.4 Regulation of Population Size
Factors That Regulate
Population Growth
Density-Independent Factors :
the intensity of the effect
does not
increase with increased population
density.
Abiotic
factors such as freezes,
droughts, forest fires, floods etc are
usually density –independent
factors.
44. Regulation of Population Size
Factors That Regulate Population
Growth
Density Dependent Factors
:
the percentage of the population
affected
does
increase as the density
of the population increases.
Biotic
factors such competition
and parasitism, diseases are often.
Competition
Example: Woodpeckers
44. Regulation of Population Size
Density Dependent
Factors
Predation
Example: Hawk and
field mice
44. 5 Life History Patterns
Populations can vary on the number of births per reproductive event, age of reproduction,
life span etc.
These are part of
species life history
.
Life histories
often contain characteristics that are trade-offs and Natural Selection shapes
the final life history of individual species and therefore it is not surprising that related
species may have different life history patterns.
Example : Frogs and Toads
44. 5 Life History Patterns
:
r-selection vs. K-selection
Logistic population growth model
suggests that some organisms are subject to r-
selection or k-selection and thus are called r-strategists or K-strategists(as in reproductive
strategies)
r-selection (favors r-strategists)
-fluctuating and/or unpredictable environments
-density-dependent factors will keep populations in the lag or exponential phase of population growth.
-Population size is low relative to the carrying capacity (K)
(so this means low pop density)
r-strategists organisms
-
Small individuals that mature early
-
Short lifespan
-
Produce many relatively small offspring
-
no energy invested in parental care
-usually are very good dispersers and colonizes of new habitats
-examples are
opportunistic species
(annual plants , rodents, bacteria & insects)
r-selection vs. K-selection
K-selection
(favors K-strategists)
-Environments are relatively stable
-Population sizes tend to be near K
-Resources such as food and shelter will be relatively scarce for these individuals
-thus those that are best able to compete will have larger numbers of offspring
K-strategists
-energy invested in their own growth and survival
-energy invested in offspring
-individuals are fairly large
-late to mature
-low fecundity and parity
-fairly long lived
-”
equilibrium species
” strong competetors and when they become established can exclude
opportunistic species (
florida panther and large mammals, birds of prey and long-lived
plants like oak trees)
Explore the intricacies of population ecology, demography, distribution patterns, and growth rates in natural populations. Learn about limiting factors, resources, biotic potential, and the concept of carrying capacity. Gain insights into population dynamics and the interplay between organisms and their environment.

Download Presentation

Please find below an Image/Link to download the presentation.
The content on the website is provided AS IS for your information and personal use only. It may not be sold, licensed, or shared on other websites without obtaining consent from the author. Download presentation by click this link. If you encounter any issues during the download, it is possible that the publisher has removed the file from their server.
E N D
Presentation Transcript
Course Objectives Define the following ecological terms: Population, population density, community, population distribution, diversity, Limiting factors, resources, biotic potential (r ), carrying capacity ( K ), Survivorship. Also, Exponential Growth vs. Logistic Growth and the corresponding curves on a graph.
44.1 Scope of Ecology Ernst Haeckel, 1866 Ecology: the study of the interactions among all organisms and with their physical environment. Ecology , as a study, has many levels: Habitat Population Community Ecosystem Biosphere A central goal of modern ecology is to develop models that explain and predict the distribution and abundance of organisms.
44. 2 Demographics of Populations Demography: the statistical study of a population, such as its density, distribution and rate of growth. Population density: the number of individuals per unit of area ( example 73 / sq. mi in USA) Resources: the abiotic (non living) and biotic (living) components of an environment. water, shelter, food, mates, space etc. Limiting Factors: are those environmental aspects that particularly determine where an organism lives. - sometimes are the maximum tolerance of certain environmental conditions that an organism can live in. Example: Fish in water at different temps and oxygen levels
Patterns of Distribution Three main observed types: Clumped Random Uniform However patterns are also relative to scale!! Kangaroos may seem clumped if you look at a global scale ( they are all grouped in Australia) Also, distribution patterns do not have to remain constant but can change with the organisms stage of life.
Population Growth Rate of natural increase (r ) : growth rate which is dependent on the number of individuals born each year and the number of individuals that die each year. Example: 30 births -10 deaths / 1000 = .02 = 2.0 % Biotic Potential :the highest possible rate of natural increase when resources are unlimited. Biotic Potential depends on certain characteristics: Usual number of offspring per reproductive event Chances of survival until age of reproduction How often each individual reproduces Age at which reproduction begins Mortality patterns Cohort: all the members of a population born at the same time. Cohorts are used to create life table.
Population Growth Survivorship Curves: Type I Type II Type III
Survivorship Curves Survivorship : the probability of newborn individuals of a cohort surviving to particular ages Survivorship Curves: Type I Type II Type III
44. 3 Population Growth Models Semelparity : members of the population have only a single reproductive event in their lifetime. Characteristics at reproductive time, mature adults stop growing all energy is directed (and used) for reproduction adults die after reproducing this is adaptive to unstable environments Iteroparity: members of the population experience many reproductive events throughout lifetime. Characteristics: continue to invest energy into continued survival this increases their chances of reproducing again It is important to know that not all reproduction fits these two models but most will. The two models of population growth have characteristic graphs
Exponential and Logistic Growth A species model of population growth can be used to predict the future population growth. Semelparous species often exhibit Exponential Growth ( seen as a J curve). Exponential Growth = number of individuals added each generation increases as the total number of females increases. The J curve has two phases: Lag phase Exponential growth phase R= 2.4* R is used for discreet breeding events instead of r
Exponential and Logistic Growth Logistic Growth (sigmoidial curve or S curve) Lag phase Exponential growth phase Deceleration Phase Stable equilibrium phase. This is seen when the environmental factors oppose growth Carrying Capacity (K) : the maximum number of individuals of a given species the environment can support.
Growth Curves and Population Management Exponential growth and Logistic growth curves both can be used to indicate what management strategies to use. If you want to keep birth rates high then keep a population small enough to stay in exponential growth so that biotic potential can have full effect (fish farm for food) If you want to keep a population limited (such as a crop pest), then do things in the environment that will reduce the carrying capacity ( instead of reducing population which brings you back to exponential growth)
44.4 Regulation of Population Size Factors That Regulate Population Growth Density-Independent Factors : the intensity of the effect does not increase with increased population density. Abiotic factors such as freezes, droughts, forest fires, floods etc are usually density independent factors.
44. Regulation of Population Size Factors That Regulate Population Growth Density Dependent Factors: the percentage of the population affected does increase as the density of the population increases. Biotic factors such competition and parasitism, diseases are often. Competition Example: Woodpeckers
44. Regulation of Population Size Density Dependent Factors Predation Example: Hawk and field mice
44. 5 Life History Patterns Populations can vary on the number of births per reproductive event, age of reproduction, life span etc. These are part of species life history. Life histories often contain characteristics that are trade-offs and Natural Selection shapes the final life history of individual species and therefore it is not surprising that related species may have different life history patterns. Example : Frogs and Toads
44. 5 Life History Patterns: r-selection vs. K-selection Logistic population growth model suggests that some organisms are subject to r- selection or k-selection and thus are called r-strategists or K-strategists(as in reproductive strategies) r-selection (favors r-strategists) -fluctuating and/or unpredictable environments -density-dependent factors will keep populations in the lag or exponential phase of population growth. -Population size is low relative to the carrying capacity (K) (so this means low pop density) r-strategists organisms -Small individuals that mature early -Short lifespan -Produce many relatively small offspring -no energy invested in parental care -usually are very good dispersers and colonizes of new habitats -examples are opportunistic species (annual plants , rodents, bacteria & insects)
r-selection vs. K-selection K-selection (favors K-strategists) -Environments are relatively stable -Population sizes tend to be near K -Resources such as food and shelter will be relatively scarce for these individuals -thus those that are best able to compete will have larger numbers of offspring K-strategists -energy invested in their own growth and survival -energy invested in offspring -individuals are fairly large -late to mature -low fecundity and parity -fairly long lived - equilibrium species strong competetors and when they become established can exclude opportunistic species (florida panther and large mammals, birds of prey and long-lived plants like oak trees)