Flood Risk Summary in Region 10 and Counties
Explore flood risk statistics and demographic data for Region 10, Marshall County, and Ohio County, including population displacement, building loss estimates, and vulnerability indices. Stay informed to understand the potential impact of flooding in these areas.

Download Presentation

Please find below an Image/Link to download the presentation.
The content on the website is provided AS IS for your information and personal use only. It may not be sold, licensed, or shared on other websites without obtaining consent from the author. If you encounter any issues during the download, it is possible that the publisher has removed the file from their server.
You are allowed to download the files provided on this website for personal or commercial use, subject to the condition that they are used lawfully. All files are the property of their respective owners.
The content on the website is provided AS IS for your information and personal use only. It may not be sold, licensed, or shared on other websites without obtaining consent from the author.
E N D
Presentation Transcript
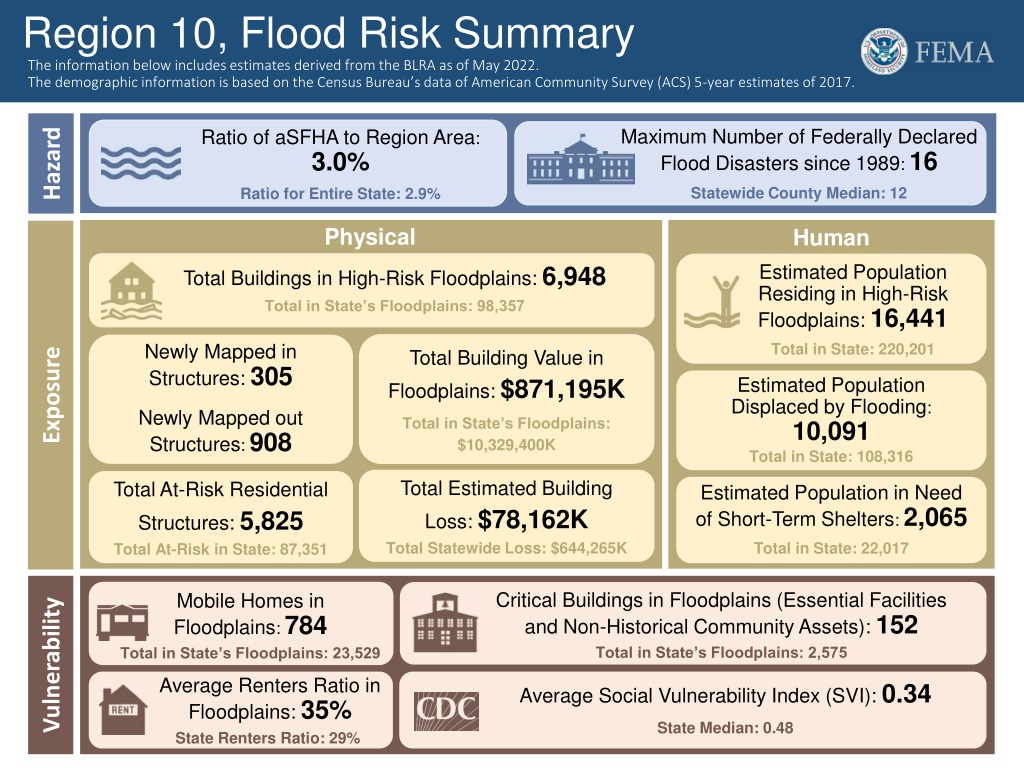
Region 10, Flood Risk Summary The information below includes estimates derived from the BLRA as of May 2022. The demographic information is based on the Census Bureau s data of American Community Survey (ACS) 5-year estimates of 2017. Maximum Number of Federally Declared Flood Disasters since 1989: 16 Statewide County Median: 12 Ratio of aSFHA to Region Area: 3.0% Ratio for Entire State: 2.9% Hazard Physical Human Estimated Population Residing in High-Risk Floodplains: 16,441 Total in State: 220,201 Total Buildings in High-Risk Floodplains: 6,948 Total in State s Floodplains: 98,357 Newly Mapped in Structures: 305 Total Building Value in Floodplains: $871,195K Exposure Estimated Population Displaced by Flooding: 10,091 Total in State: 108,316 Newly Mapped out Structures: 908 Total in State s Floodplains: $10,329,400K Total Estimated Building Loss: $78,162K Total Statewide Loss: $644,265K Total At-Risk Residential Structures: 5,825 Total At-Risk in State: 87,351 Estimated Population in Need of Short-Term Shelters: 2,065 Total in State: 22,017 Critical Buildings in Floodplains (Essential Facilities and Non-Historical Community Assets): 152 Total in State s Floodplains: 2,575 Mobile Homes in Floodplains: 784 Total in State s Floodplains: 23,529 Vulnerability Average Renters Ratio in Floodplains: 35% State Renters Ratio: 29% Average Social Vulnerability Index (SVI): 0.34 State Median: 0.48
Marshall County, Flood Risk Summary The information below includes estimates derived from the BLRA as of May 2022. The demographic information is based on the Census Bureau s data of American Community Survey (ACS) 5-year estimates of 2017. Number of Federally Declared Flood Disasters since 1989: 12 Statewide County Median: 12 Ratio of aSFHA to County Area: 2.9% Statewide County Median: 2.9% Hazard Physical Human Estimated Population Residing in High-Risk Floodplains: 3,590 Statewide County Median: 2,425 Total Buildings in High-Risk Floodplains: 1,563 Statewide County Median: 1,080 Newly Mapped in Structures: 71 Total Building Value in Floodplains: $225,646K Exposure Estimated Population Displaced by Flooding: 1,524 Statewide County Median: 1,135 Newly Mapped out Structures: 293 Statewide County Median: $111,255K Total Estimated Building Loss: $16,918K Statewide County Median: $7,642K Total At-Risk Residential Structures: 1,342 Statewide County Median: 987 Estimated Population in Need of Short-Term Shelters: 318 Statewide County Median: 223 Mobile Homes in Floodplains: 352 Statewide County Median: 230 Critical Buildings in Floodplains (Essential Facilities and Non-Historical Community Assets): 41 Statewide County Median: 34 Vulnerability Renters Ratio in Floodplains: 42% Statewide County Median: 29% Social Vulnerability Index (SVI), 0 to 1: 0.19 Statewide County Median: 0.48
Ohio County, Flood Risk Summary The information below includes estimates derived from the BLRA as of May 2022. The demographic information is based on the Census Bureau s data of American Community Survey (ACS) 5-year estimates of 2017. Number of Federally Declared Flood Disasters since 1989: 10 Statewide County Median: 12 Ratio of aSFHA to County Area: 3.1% Statewide County Median: 2.9% Hazard Physical Human Estimated Population Residing in High-Risk Floodplains: 8,329 Statewide County Median: 2,425 Total Buildings in High-Risk Floodplains: 3,437 Statewide County Median: 1,080 Newly Mapped in Structures: 173 Total Building Value in Floodplains: $417,467K Exposure Estimated Population Displaced by Flooding: 5,861 Statewide County Median: 1,135 Newly Mapped out Structures: 544 Statewide County Median: $111,255K Total Estimated Building Loss: $36,012K Statewide County Median: $7,642K Total At-Risk Residential Structures: 2,870 Statewide County Median: 987 Estimated Population in Need of Short-Term Shelters: 1,187 Statewide County Median: 223 Mobile Homes in Floodplains: 205 Statewide County Median: 230 Critical Buildings in Floodplains (Essential Facilities and Non-Historical Community Assets): 42 Statewide County Median: 34 Vulnerability Renters Ratio in Floodplains: 39% Statewide County Median: 29% Social Vulnerability Index (SVI), 0 to 1: 0.37 Statewide County Median: 0.48
Wetzel County, Flood Risk Summary The information below includes estimates derived from the BLRA as of May 2022. The demographic information is based on the Census Bureau s data of American Community Survey (ACS) 5-year estimates of 2017. Number of Federally Declared Flood Disasters since 1989: 16 Statewide County Median: 12 Ratio of aSFHA to County Area: 3.0% Statewide County Median: 2.9% Hazard Physical Human Estimated Population Residing in High-Risk Floodplains: 4,523 Statewide County Median: 2,425 Total Buildings in High-Risk Floodplains: 1,948 Statewide County Median: 1,080 Newly Mapped in Structures: 61 Total Building Value in Floodplains: $228,082K Exposure Estimated Population Displaced by Flooding: 2,706 Statewide County Median: 1,135 Newly Mapped out Structures: 71 Statewide County Median: $111,255K Total Estimated Building Loss: $25,233K Statewide County Median: $7,642K Total At-Risk Residential Structures: 1,613 Statewide County Median: 987 Estimated Population in Need of Short-Term Shelters: 560 Statewide County Median: 223 Mobile Homes in Floodplains: 227 Statewide County Median: 230 Critical Buildings in Floodplains (Essential Facilities and Non-Historical Community Assets): 69 Statewide County Median: 34 Vulnerability Renters Ratio in Floodplains: 25% Statewide County Median: 29% Social Vulnerability Index (SVI), 0 to 1: 0.46 Statewide County Median: 0.48