Introduction to Flood Risk Assessment with HEC-FDA Overview
This presentation delves into flood risk assessment using HEC-FDA software, covering topics such as defining flood risk, components of uncertainty, consequences of flood risk, and methods to assess flood risk including hydrology, hydraulics, geotechnical, and economics. It explores the intersection of flood probability and consequences, and compares flood risk in different study areas based on probability and consequences. Images aid in understanding flood risk assessment concepts.

Download Presentation

Please find below an Image/Link to download the presentation.
The content on the website is provided AS IS for your information and personal use only. It may not be sold, licensed, or shared on other websites without obtaining consent from the author.If you encounter any issues during the download, it is possible that the publisher has removed the file from their server.
You are allowed to download the files provided on this website for personal or commercial use, subject to the condition that they are used lawfully. All files are the property of their respective owners.
The content on the website is provided AS IS for your information and personal use only. It may not be sold, licensed, or shared on other websites without obtaining consent from the author.
E N D
Presentation Transcript
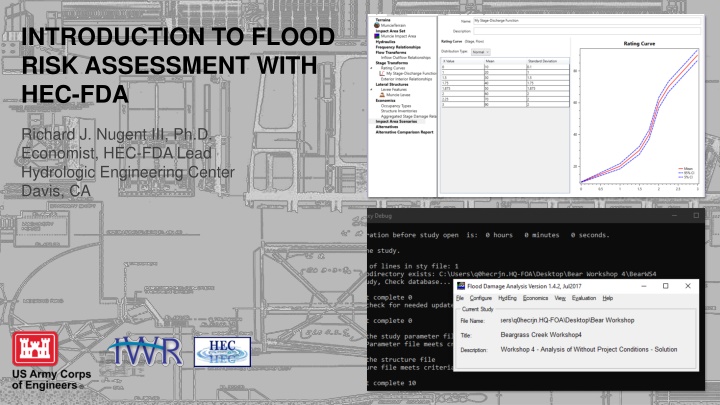
INTRODUCTION TO FLOOD RISK ASSESSMENT WITH HEC-FDA Richard J. Nugent III, Ph.D. Economist, HEC-FDA Lead Hydrologic Engineering Center Davis, CA
2 AGENDA 1. What is flood risk, and how do we describe it? 2. How do we assess flood risk? 3. What goes into the uncertainty about flood risk? a) Hydrology b) Hydraulics c) Economics 4. How do we incorporate our estimates of uncertainty about flood risk? 5. I computed EAD. I am done, right? a) SPOILER ALERT: NOPE!
3 AUTHORSHIP This presentation draws upon materials authored by: Cameron Ackerman Nick Applegate Gary Brunner Beth Faber Gregory Karlovits Kurt Keilman John Kucharski Will Lehman Brian Maestri Richard Nugent William Scharffenberg
4 WHAT IS FLOOD RISK?
5 WHAT IS FLOOD RISK? Risk Analysis Risk Risk Management Assessment Risk Communication
6 WHAT IS FLOOD RISK?
7 WHAT IS FLOOD RISK?
8 WHAT IS FLOOD RISK? CONSEQUENCES PROBABILITY Flood Risk (simplified) = Flood Probability x Flood Consequences
9 COMPONENTS OF FLOOD RISK Image from Rijkswaterstaat, The Netherlands
WHICH STUDY AREA HAS HIGHER FLOOD RISK? 10 Probability x Consequences Study Area A: Study Area B: 50% Annual Chance of Flooding 15-foot Flood Depth 1% Annual Chance of Flooding 4-foot Flood Depth
11 HOW DO WE ASSESS FLOOD RISK?
12 HOW DO WE ASSESS FLOOD RISK? 1. Hydrology Focus is water in watershed a) Amount of water b) Rate of flow c) Frequency 2. Hydraulics Focus is water in channel/floodplain a) Depth of water for given rate of flow b) Velocity 3. Geotechnical Focus is levee performance a) Chance of failure for a given flood magnitude 4. Economics Focus is stuff in the floodplain a) Value of assets/number of people in the flood plain b) First floor elevations/number of stories c) Damage/life loss for given flood magnitude d) Indirect economic impact Hazard Performance Exposure Vulnerability Consequences
13 MEASURE OF FLOOD RISK: EXPECTED ANNUAL DAMAGE (EAD) high low low high
14 FLOOD RISK WITH UNCERTAINTY Hydrology (Flows)
15 HYDROLOGY: FLOW EXCEEDANCE PROBABILITY FUNCTION high low high low
16 HYDROLOGIC DATA AND RELATIONSHIPS Flow-exceedance probability functions: what is the distribution of flows for a given exceedance probability? a) Analytical: flow can be described by the Log Pearson Type III (LP3) distribution, uncertainty defined by LP3 moments using Bulletin 17B procedures b) Graphical: flow cannot be described by LP3. Graphical draws a straight line between flow values. Uncertainty defined by equivalent record length and distance between flow values using order statistics and the less simple method.
17 HYDROLOGIC UNCERTAINTY Analytical using peak flows: Measurement uncertainty Transform uncertainty Sampling uncertainty Model uncertainty Analytical or graphical using modeling: Boundary condition uncertainty Initial condition uncertainty Model uncertainty Parameter uncertainty
18 HYDROLOGIC UNCERTAINTY
19 FLOOD RISK WITH UNCERTAINTY Hydraulics (Stages)
20 HYDRAULICS: STAGE-FLOW FUNCTION high low high low
21 HYDRAULIC DATA AND RELATIONSHIPS 1. WSP: WSE a) b) c) WSE at a given location and frequency WSE are computed using hydraulic modeling (e.g. RAS) WSE are used to compute damage at a structure, either through interpolation between stations or by identifying the WSE at the structure s location (in the case of 2D modeling) 2. Stage-Discharge Function (Rating Curve): what is the distribution of stages for a given discharge? a) Typically computed using observations on stage versus flow b) Error bounds computed using hydraulic modeling 3. Hydraulic structures: How does the water react to hydraulic structures? a) Levees, diversions, dams, weirds, drop structures, bridges, culverts, etc.
22 HYDRAULIC UNCERTAINTY Water Surface Profiles: Applying procedures where assumptions are not valid Numerical errors Geometry Measurement Parameter Estimation Stage-Discharge: Changes in cross section and roughness Measurement error Influence of backwater Other Factors? Hydraulic Structures: Bridge/culvert parameters Inline Structures (dams, weirs, drop structures etc) Lateral structures (levees, diversions, etc) Boundary conditions
23 FLOOD RISK WITH UNCERTAINTY Levee Performance
24 Uncertainty in Levee Performance
25 FLOOD RISK WITH UNCERTAINTY Economics
26 ECONOMICS: STAGE-DAMAGE RELATIONSHIP high low high low
27 THE LINKS FROM WATER TO VALUE TO DAMAGE Structure First Floor Elevation Elevation Depth of Water Flood Water Surface Elevation over First Floor Depth Structure Depth Damage Structure Value Content to Structure Value Ratio Content Content Depth Damage Value Depth Structure Content Content Depth Structure Damage Content Damage Stage
28 28 STAGE-DAMAGE SOURCES OF UNCERTAINTY Depth-percent damage with uncertainty Number of structures by category and construction type Structure values by building type and use Content values by building type and use First floor elevation of structure Damage as a percent of value for structure/contents for range of flood depths Planning Associates Flood Risk Management Course
29 HOW DO WE INCORPORATE OUR ESTIMATES OF UNCERTAINTY INTO OUR RISK ASSESSMENT? CURVE SAMPLING!
30 FDA METHOD Flow Flow This process results in 1 realization of EAD, it is not the final estimate of EAD 1 0 Exceedance probability stage Damage Damage Integrate! stage 0 1 Exceedance probability
31 FDA EAD COMPUTE WITH SAMPLING Running Average 0.6 Mean = average = EAD . Average of the Realization EADs 0.5 0.4 Relative Frequency ^ EAD 0.3 Annual Damages 0.2 Damages 0.1 0 1,000,000 1,500,000 2,000,000 2,500,000 2,750,000 3,250,000 3,750,000 4,000,000 4,250,000 4,500,000 5,000,000 5,500,000 5,750,000 6,000,000 1,250,000 1,750,000 2,250,000 3,000,000 3,500,000 4,750,000 5,250,000 250,000 750,000 500,000 0 Number of realizations Annual Damage ($) 1st Realization 40 35 100 realizations 30 Relative Frequency Integration of the curve = Realization EAD1 25 EAD estimates 20 15 10 5 0 1,000,000 1,250,000 1,500,000 1,750,000 2,000,000 2,250,000 2,500,000 2,750,000 3,000,000 3,250,000 3,500,000 3,750,000 4,000,000 4,250,000 4,500,000 4,750,000 5,000,000 5,250,000 5,500,000 5,750,000 6,000,000 250,000 500,000 750,000 0 0 1 Annual exceedance probability (for the hydrology) Average Damage (EAD) $ 31
32 BUT WAIT, THERE IS MORE! Project performance
33 ANNUAL EXCEEDANCE PROBABILITY Annual Exceedance Probabilityit is the probability that a specific capacity or target stage will be exceeded in a given year. For levees, it is the chance of failure or exceedance in any given year. AEP includes the full range of events. The inverse of the AEP should not be considered the level of protection for a project.
34 LONG-TERM RISK Long-term risk (also long-term exceedance probability) The probability that one or more flood events will occur within a specified time period or the likelihood the target stage will be exceeded in a specified time period. The calculations are made directly using the binomial distribution (See EM 1110-2- 1415). Chance of flooding 1 or more times in t years= AEPt 1 (1 )
35 LONG TERM RISK Chance of flooding 1 or more times in 30 years = 1 1 0.16230 = 0.995
36 ASSURANCE OF EVENT Assurance (formerly conditional non- exceedance) The chance that a specific target (e.g. the top of a levee) will not be exceeded, given the occurrence of a specific flood event (e.g. The project can pass a 1% flood event with 90% assurance. )
37 ASSURANCE OF AEP Assurance The chance that an annual overtopping or significant flooding event is less than a standard frequency (e.g. 1%). Assurance of AEP and Assurance of a target stage are equivalent in the absence of a fragility curve.
38 ASSURANCE OF AEP In the case that a levee fragility curve has been defined, assurance of AEP will not be the same as assurance of a given event.
39 QUESTIONS?