Modern End-to-End Programming: Data Preparation, Model Building & Debugging
Prepare, build, debug models covering historical data. Make assumptions, solve equations, ensure data, economic consistency. Iterative processes for accurate simulations.
3 views • 10 slides

Advancements in Arduino Core API with Zephyr and Linux for IoT Systems
Explore the evolution of Arduino Core API with advancements in Zephyr and Linux for IoT systems. Learn how developers can leverage Zephyr RTOS features with Arduino-style syntax, making development easier and more efficient. Discover the benefits of integrating Arduino with Zephyr for enhanced debug
3 views • 30 slides

System Models in Software Engineering: A Comprehensive Overview
System models play a crucial role in software engineering, aiding in understanding system functionality and communicating with customers. They include context models, behavioural models, data models, object models, and more, each offering unique perspectives on the system. Different types of system
2 views • 33 slides
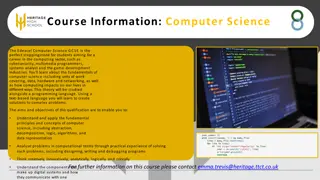
Explore Edexcel Computer Science GCSE Course Information
The Edexcel Computer Science GCSE is an ideal pathway for students interested in a computing career, covering fundamental computer science principles, practical problem-solving using a programming language, and understanding digital systems. The course focuses on developing creativity, analytical th
1 views • 4 slides
Welcome to CS2100 - Semester 2 AY2023/24
CS2100 is a fundamental computing module at NUS. The course covers topics such as data representation, computer components, C programming, and practical aspects like debugging and software design. Meet the dedicated lecturers, access course materials on Canvas, and dive into the hardware/software st
0 views • 18 slides
Effective Debugging Techniques Using Clion IDE and GDB
Understanding the necessity of debugging in code development, exploring common debugging techniques, utilizing GDB for debugging, and working with Clion IDE debugger for efficient program debugging. Learn how to debug buggy programs, set breakpoints, print values, and run programs in debug mode for
0 views • 10 slides
Evolution of Operating Systems: From Mainframe Computers to Unix
Before the 1950s, users interacted directly with mainframe computers without an operating system, debugging using control panels. The transition to writing programs in symbolic languages led to the need for specific drivers. Run queues and operator-assisted job submissions marked this era. The first
0 views • 41 slides
Debugging Movement Programming Events and Actions
Explore the process of debugging in programming, focusing on identifying and fixing bugs in a program. Learn how to test a program against a given design, match code to outcomes, and modify programs using existing designs. Engage in practical activities to improve your debugging skills.
0 views • 21 slides
Comprehensive EMI Design Suite for Effective EMI Management
The EMI Design Suite aims to address EMI issues upfront in product development, offering insight to system engineers, guiding hardware selection, assisting in EMI filter design, and streamlining EMI testing and debugging. By focusing on EMI requirements from the start, the suite enhances overall pro
0 views • 15 slides
Troubleshooting Machine Learning Systems: Tips and Strategies
Dive into the world of diagnosing and debugging machine learning systems with insights on fixing learning algorithms, understanding model failures, and strategies for improvement. Explore the importance of data collection, feature selection, hyperparameter tuning, and more to enhance your system's p
0 views • 43 slides
15-213 Recitation: Bomb Lab Overview and Tips
This content covers the Bomb Lab exercise in x86-64 assembly code and GDB debugging techniques. It explains the purpose of Bomb Lab, downloading the bomb, detonating the bomb, hints for solving phases, and x86-64 Linux register usage. The material emphasizes the importance of using GDB for efficient
0 views • 42 slides
Progression in Computing: National Curriculum Overview for KS1 and KS2
Explore the comprehensive National Curriculum guidelines for Key Stage 1 (KS1) and Key Stage 2 (KS2) students focusing on Information Technology and Computer Science. Topics covered include understanding algorithms, creating and debugging programs, using technology purposefully, developing logical r
0 views • 48 slides
Understanding Debugging in Programming
Debugging is a crucial aspect of programming to identify and fix errors that can cause program failures, hangs, or unexpected results. There are different types of errors such as compile errors, runtime errors, and logic errors, each requiring a different approach to resolve. Learning about the mode
0 views • 20 slides
Enhancing Network Debugging with CherryPick in Software-Defined Datacenter Networks
Explore CherryPick, a technique for tracing packet trajectory in software-defined datacenter networks. It helps in debugging by ensuring data plane conforms with control plane policies, localizing network problems, and enabling packet trajectory tracing challenges like non-shortest paths. CherryPick
0 views • 14 slides

A Dive into GDB Scripting Hidden Gems with Albert Lee
Delve into the world of GDB scripting hidden gems with Albert Lee on November 15, 2018. Explore essential features like debugging, register inspection, low-level memory views, and source-level code analysis. Understand techniques to enhance your debugging skills through the exploration of assembly c
0 views • 22 slides

Understanding and Debugging JESD204B: Practical Guide
This guide provides a comprehensive overview of understanding and debugging JESD204B interfaces. From achieving CGS and ILAS phases to troubleshooting user data alignment issues, it covers essential steps and tips for successful implementation and debugging. The content includes an introduction to t
0 views • 32 slides
Debugging Tips for Carnegie Mellon's Malloc Lab
Explore essential debugging strategies for the Carnegie Mellon Malloc Lab, focusing on identifying errors, resolving segfaults, and implementing a heap checker to maintain well-formed heaps. Learn how to efficiently troubleshoot issues and improve your debugging skills in computer systems.
0 views • 19 slides
Chi: A Scalable and Programmable Control Plane for Distributed Stream Processing
Distributed stream processing systems are increasingly crucial for various production use cases, such as real-time dashboards, machine learning, and interactive debugging. The challenges of handling large variability in production ingestion workloads and high-degree data skew in queries are addresse
1 views • 20 slides
Computer Networks and WANs: Week Four Overview
This week's session covers VMware View Client commands, traffic flow device configurations, Asynchronous Transfer Mode (ATM), Quality of Service (QoS), and more. Explore hands-on activities in MIMIC Virtual Lab CCNA and learn essential commands for networking tasks like configuring interfaces, debug
0 views • 70 slides
Carnegie Mellon Multithreaded Synchronization Recitation
Explore Carnegie Mellon's recitation on multithreaded synchronization, debugging tools, shared memory synchronization, critical sections, and locking. Dive into the Echo Server Sequential Handling code examples, finding weaknesses using telnet, and advanced debugging techniques with curl and binary
0 views • 34 slides
Understanding the .NET Architecture Components
The .NET architecture comprises various key components such as the Common Language Specification, Code Manager, Managed Code, Unmanaged Code, and Native Code. These components play crucial roles in the development and execution of applications within the .NET framework. Managed code is executed by t
0 views • 21 slides
Unified Approach for Performance Evaluation and Debug of System on Chip in Early Design Phase
This presentation discusses the challenges related to system-on-chip design, focusing on bandwidth issues, interconnect design, and DDR efficiency tuning. It explores the evolution of performance evaluation methods and the limitations of existing solutions. The need for a unified approach for early-
0 views • 28 slides

Enhancing Replay Interface Efficiency in System Debugging
Efforts by researchers at Microsoft Research Asia and MIT focus on enhancing replay interface efficiency for system debugging. The motivation stems from the non-determinism challenges caused by time, user input, network I/O, and thread interleaving. The study observes that only certain parts of a pr
0 views • 26 slides
Understanding Real-time Debug Techniques for Embedded Development
Real-time debugging in embedded systems involves different modes like stop mode and real-time mode, each offering unique capabilities for accessing memory, registers, and handling interrupts. This technique allows developers to examine and modify memory contents while the processor is running, enabl
0 views • 32 slides
Understanding Debugging in High-Level Languages
Debugging in high-level languages involves examining and setting values in memory, executing portions of the program, and stopping execution as needed. Different types of errors – syntactic, semantic, and algorithmic – require specific debugging approaches. Syntactic errors are related to code l
0 views • 9 slides
Simplifying Post-Silicon Timing Diagnosis with NGSPA Tool
Explore how the NGSPA tool by Intel simplifies post-silicon timing diagnosis, replacing costly machines with a CAD application running on an x86 server, saving resources and enabling parallelized CAD operations. Learn about the challenges in post-silicon speed debugging, the importance of static tim
0 views • 26 slides
Debugging Techniques in Constructive Computer Architecture
Explore debugging methods in constructive computer architecture tutorial sessions, focusing on debugging BSV code, typeclasses, and functional style. Learn how to use print and display statements effectively, handle conflicts, and identify and fix common bugs. Dive into the significance of ways to d
0 views • 40 slides
Advanced Strategies for Effective Debugging in Software Development
Learn about quality engineering, programming, bug detection techniques, and common challenges in debugging complex software. Explore real-world scenarios, such as debugging Mozilla Firefox and handling various bugs in different environments like compilers, databases, and operating systems.
0 views • 35 slides
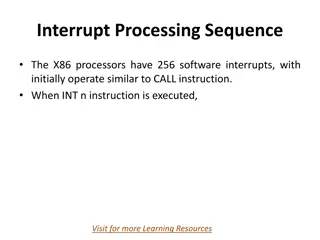
Understanding Interrupt Processing Sequence in X86 Processors
X86 processors have 256 software interrupts, functioning similarly to a CALL instruction. When an INT n instruction is executed, the processor follows a sequence involving pushing the flag register, clearing flags, finding the correct ISR address, and transferring CPU control. Special interrupts lik
0 views • 10 slides
Understanding Network Management Processes in Computer Networks
Explore network management processes including fault management, syslog, configuration management, and more as defined by the International Organization for Standardization (ISO). Learn about the importance of syslog for computer message logging and how it can be utilized for system management, secu
0 views • 72 slides

Strategies to Reduce Time Spent Debugging in Software Development
Strategies for reducing debugging time in software development include producing working code with minimal effort, optimizing processes involving code and computer, forming hypotheses to explain bugs, conducting tests, using best practices, and conducting experiments for effective debugging. Signifi
0 views • 50 slides
DarkBox Setup and Testing Overview
This content provides an in-depth overview of the DarkBox setup and testing process conducted by V. Kulikovskiy and others in Napoli. It covers the setup finalization, software installation, extensive data acquisitions, challenges faced, and collaboration with external experts. The content showcases
0 views • 17 slides
Scalable Query System for Complex Game Environments Evaluation
Designing a scalable query system for evaluating complex game environments involves key elements like defining required features, structuring query elements, and understanding function models for optimal performance. The system must be customizable, support debugging, and allow runtime parameter adj
0 views • 41 slides
Debugging Techniques in Shell Scripting: CSCI 330 UNIX and Network Programming Overview
Explore the debugging techniques presented in the CSCI 330 UNIX and Network Programming course, including using echo statements, the set command for tracing execution, and the case statement for decision making. Learn how to troubleshoot errors in shell scripts efficiently.
0 views • 29 slides

Coding Tips and Practices for Success
Explore essential coding practices such as working with linked files, debugging techniques, rubber duck debugging, frank encoding, and more to enhance your coding skills and efficiency. Discover the core elements of HTML, CSS, and JavaScript and learn how to optimize your coding process for better r
0 views • 14 slides
Debugging PMP Systems: A Guideline for Application Engineers
Comprehensive guideline by Vincenzo Pizzolante on debugging PMP systems for application engineers, covering topics like analysis, technical aspects, layout guidelines, trace inductance, case studies, and dealing with noise generators. Includes real-life examples and actionable solutions for managing
0 views • 33 slides
Understanding Nachos Operating System Development Project
Nachos is instructional software for teaching operating systems courses. This project guide covers the installation on Ubuntu, debugging, and fixing issues in Project 1 related to program execution. Learn to trace code, fix bugs, and modify Nachos to support multiprogramming. Submit your report by t
0 views • 7 slides

Exploring Fault Localization Techniques in Software Debugging
Various fault localization techniques in software debugging are discussed, including black-box models, spectrum evaluation, comparison of artificial and real faults, failure modes, and design considerations. The importance of effective fault localization and improving fault localization tools is hig
0 views • 24 slides
Introduction to Programming in R: Coding, Debugging, and Optimizing
Explore the world of programming in R with a focus on coding, debugging, and optimizing techniques. Learn from Katia Oleinik at Boston University about scientific computing and visualization in R. Discover the power of if statements, comparison operators, and enhance your skills in R programming.
0 views • 73 slides
Understanding Domain Name System (DNS) Resolver Operation and Debugging
The session explores the operation of Domain Name System (DNS) resolvers, focusing on how resolvers work, caching, and querying authoritative nameservers. It delves into the process of resolving queries, locating authoritative nameservers, handling cache misses, and the hierarchical structure of DNS
0 views • 37 slides