Interactive Computer Graphics
This course covers Interactive Computer Graphics, focusing on generating images/videos through computers with applications in gaming, movies, CAD, visual arts, and scientific visualization. Prerequisites include fluency in C/C++, familiarity with linear algebra, and a passion for games. The course i
0 views • 30 slides
Explore the World of Computer Graphics in CSE452
Dive into the fascinating realm of computer graphics with CSE452. Learn about modeling, rendering, animation, and its various applications in entertainment, design, education, and more. Discover the techniques of computer-aided design, 3D scanning, procedural modeling, and rendering for photorealist
12 views • 24 slides
Create Your Own American Heart Month Graphics!
Celebrate American Heart Month by creating your own heart-healthy graphics and sharing your message on social media. Use the provided templates to design eye-catching visuals and spread awareness about the importance of living a heart-healthy lifestyle. Follow the steps to customize your graphics, a
0 views • 11 slides
Computer Graphics: Evolution and Applications
Computer graphics represent the creation and manipulation of visual information using specialized hardware and software. This field has evolved since the 1950s, enabling diverse applications like entertainment, CAD, education, e-commerce, and computer art. The origins date back to MIT's early displa
1 views • 22 slides
Digital Differential Analyzer (DDA) Algorithm in Computer Graphics
In computer graphics, the Digital Differential Analyzer (DDA) Algorithm is utilized as the basic line drawing algorithm. This method involves interpolation of variables between two endpoints to rasterize lines, triangles, and polygons efficiently. The algorithm requires inputting coordinates of two
0 views • 9 slides
Understanding Variation in Statistical Studies
Variability is key in statistical studies, shaping the essence of statistical analysis. Students often struggle to grasp the concept of variability, despite being taught statistical methods. The term "variation" takes on different meanings in various statistical contexts, presenting challenges in co
2 views • 54 slides
Introduction to Data Collection & Statistics: Understanding Statistical Questions, Population, and Sampling
This material introduces the fundamental concepts of data collection and statistics. Learning objectives include distinguishing statistical questions, identifying populations and samples, and understanding the difference between observational studies and experiments. It discusses the process of stat
1 views • 14 slides
Introduction to Computer Graphics: Overview and Importance
Computer Graphics (CG) involves creating and manipulating images using computers in both 2D and 3D space. This field is crucial in various industries such as science, engineering, medicine, entertainment, and more. CG is utilized for tasks like creating complex diagrams, architectural designs, fligh
6 views • 29 slides
Understanding GPU Rasterization and Graphics Pipeline
Delve into the world of GPU rasterization, from the history of GPUs and software rasterization to the intricacies of the Quake Engine, graphics pipeline, homogeneous coordinates, affine transformations, projection matrices, and lighting calculations. Explore concepts such as backface culling and dif
0 views • 17 slides
Exploring the Power of Wise Queries in Statistical Learning
Dive into the world of statistical learning with a focus on the impact of wise queries. Discover how statistical problems are approached, the significance of statistical queries, and the comparisons between wise and unary queries. Explore the implications for PAC learning and uncover key insights in
0 views • 8 slides
Understanding IBM SPSS for Statistical Analysis
IBM SPSS, formerly known as Statistical Package for the Social Sciences, is a powerful software package for statistical analysis used by researchers across various industries. Developed in the late 1960s, SPSS offers features for data management, statistical analysis, and data documentation. It simp
1 views • 13 slides
Overview of Myanmar Statistical System and Central Statistical Organization
The Myanmar Statistical System operates as a decentralized system with the Central Statistical Organization playing a crucial role at the national level. Various surveys and data collection efforts are undertaken by different ministries and agencies, coordinated by the CSO. The CSO compiles and pres
0 views • 18 slides
The Trust Fund for Statistical Capacity Building
The Trust Fund for Statistical Capacity Building (TFSCB) is a multi-donor trust fund launched in 1999, supporting over 200 projects worldwide to strengthen statistical systems in developing countries. It focuses on national strategy development and improving statistical capacity in key priority area
1 views • 5 slides
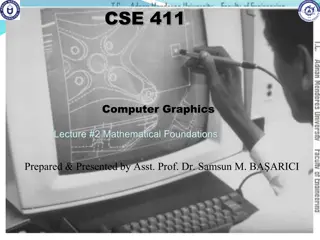
Mathematical Foundations for Computer Graphics: Geometry, Trigonometry, and Equations
This lecture covers essential mathematical tools for computer graphics, including 2D and 3D geometry, trigonometry, vector spaces, points, vectors, coordinates, linear transforms, matrices, complex numbers, and slope-intercept line equations. The content delves into concepts like angles, trigonometr
1 views • 53 slides
Exploring Next-Generation Graphics APIs: Vulkan, D3D12, and Metal
Delve into the world of next-generation graphics APIs like Vulkan, D3D12, and Metal, understanding their importance, differences, and benefits. Discover how these APIs aim to reduce CPU bottlenecks, enhance driver performance, and provide explicit, console-like control for improved graphics renderin
1 views • 59 slides
Introduction to Java Graphics and GUIs in Software Design & Implementation
Introduction to Java graphics, Swing/AWT libraries, event-driven programming, user interaction, essential terminology, and perspective in software design & implementation using Java. The material covers organization of AWT/Swing library, essential widgets/components, graphics, user events, and build
0 views • 30 slides
Understanding Computer Graphics: An Overview
Computer graphics involves creating images and animations using a computer through hardware and software systems. It has evolved significantly over the years, with advancements in generating various types of computer graphics. Learn about the basics of computer graphics, including digital image repr
0 views • 15 slides
Understanding Graphics Pipeline Clipping Techniques
Delve into the intricate process of graphics pipeline clipping in computer graphics, from breaking primitives into fragments to determining visible parts for rendering. Explore the necessity of clipping, culling, and endpoint conditions, as well as techniques like Cohen-Sutherland Line Clipping. Gai
0 views • 18 slides
Jumping into Statistics: Study Design & Statistical Analysis in Medical Research
Explore the fundamentals of study design & research methodology, learn to select appropriate statistical tests, and practice statistical analysis using JMP Pro Software. Topics include research question formulation, statistical methods, regression, survival analysis, data visualization, and more. Un
0 views • 31 slides
Enhancing Statistical Capacities of OIC Member Countries to Achieve SDGs: The Role of SESRIC
This presentation discusses the importance of enhancing statistical capacities in OIC member countries to achieve Sustainable Development Goals (SDGs), with a focus on the role of SESRIC. It covers the evolution of statistical definitions, the use of Statistical Capacity Index (SCI) for analysis, an
2 views • 17 slides
Enhancing Global Statistical Systems for Sustainable Development
The post-2015 development agenda emphasizes the need for a comprehensive global policy agenda, impacting statistical systems worldwide. This agenda seeks to improve data collection, coordinate international statistical efforts, and enhance national statistical systems by 2020 to support the Sustaina
0 views • 23 slides
Tactile Graphics in Education and Careers Symposium
This symposium explores the innovative use of tactile graphics in education and careers, showcasing advanced tools like the Graphiti system. The featured physical unit offers a versatile layout with various connectivity options, coupled with enhanced functionality for viewing and editing graphics. P
0 views • 10 slides
Raster Graphics and Scan Conversion in Computer Graphics
This lecture covers various topics related to raster graphics and scan conversion in computer graphics. It includes issues with scan converting a line, generalized line drawing algorithms, and the midpoint circle drawing algorithm. Additionally, it explores deriving mathematical expressions for draw
0 views • 21 slides
Understanding Attributes and Color Schemes in Graphics
Graphics systems utilize attributes to define how primitives are displayed, such as color and size, while color and grayscale can be stored in different ways like direct storage and indexed storage schemes. The RGB color components play a key role in determining the color shades, with various color
0 views • 51 slides
Installing the Zelle Graphics Package for Python
Learn how to install the Zelle graphics package by downloading the graphics.py file and placing it in the correct location on your PC or Mac. Verify the installation by using the import graphics command in your IDE's Shell window.
0 views • 5 slides
Role of Statistical Standards in Building National Data Backbones
The role of statistical standards in constructing national data backbones is crucial for efficient data dissemination and reporting, especially in the context of Sustainable Development Goals (SDGs). Statistical standards guide the orchestration of information flows within a national statistical net
0 views • 22 slides
Statistical Events in San Diego Area (2001-2003)
Several significant statistical events took place in the San Diego area between 2001 and 2003, featuring renowned speakers and experts in the field. These events covered topics such as meta-analysis, global atmospheric changes, statistical trends, and annual statistical career days. The gatherings p
0 views • 12 slides
Overview of the U.S. Federal Statistical System and Census Geography
The U.S. Federal Statistical System comprises 13 principal statistical agencies responsible for collecting and analyzing data across various sectors. The system includes agencies like the Bureau of Economic Analysis, Bureau of Labor Statistics, and U.S. Census Bureau. Geographic identifiers (GEOIDs
0 views • 94 slides
Computer Graphics and Multimedia Applications Overview
This content provides an overview of computer graphics and multimedia applications covering topics such as primitive instancing, sweep representations, boundary representations, and spatial partitioning. It discusses the concepts and methods used in creating three-dimensional objects from two-dimens
0 views • 11 slides
Introduction to Python Turtle Graphics for GCSE Students
Explore the concept of turtle graphics in Python programming through visual representation and simple animations. Learn about the principles of turtle graphics, advantages, limitations, and how to use it effectively for learning programming. Discover the potential challenges and solutions offered by
0 views • 11 slides
Introduction to Turtle Graphics with Python
Explore the world of Turtle Graphics with Python in this interactive lesson. Learn how to use Python to create graphics on the screen, draw shapes using loops, and create a range of shapes. Complete homework assignments and follow step-by-step instructions to start creating your own Turtle graphics
0 views • 24 slides
Understanding GIF and file formats in computer graphics
GIF and file formats play a crucial role in computer graphics, defining the structure of images and animations. GIF files consist of a logical screen populated with images or frames, while file formats are divided into segments containing images, extension blocks, and trailers. Extension blocks in G
0 views • 6 slides
Strategic Due Diligence with Mekko Graphics: Empowering Decision-Making
Mekko Graphics, trusted by top private equity firms, facilitates strategic due diligence with its advanced charting features such as Marimekko and Bar Mekko charts. This tool aids in market analysis, competitive positioning, and tracking market trends over time. Utilize Mekko Graphics for comprehens
0 views • 20 slides
Understanding Raster Graphics in Computer Graphic Design
Raster graphics, also known as bitmap images, consist of a grid of pixels representing colors, viewable on screens or printed media. They are stored in various file formats and are characterized by width, height, and color depth. Contrastingly, vector graphics are line-based and offer scalability wi
0 views • 7 slides
Slovene National Statistical System Overview
The Slovene National Statistical System comprises institutions like the Statistical Office of the Republic of Slovenia and various advisory committees responsible for producing official statistical data following European and UN standards. It emphasizes neutrality, objectivity, transparency, and con
0 views • 9 slides
Understanding Graphics Scene Structures and Rendering Techniques
This content delves into the world of computer graphics, focusing on scene graphs, immediate mode graphics, OpenGL objects, imperative and object-oriented programming models, and Java implementation. It explains the storage and manipulation of graphic scenes, drawing techniques, and different progra
0 views • 21 slides
Understanding Two-Dimensional Transformations in Computer Graphics
Explore the fundamentals of two-dimensional transformations in computer graphics, covering translation, scaling, rotation, reflection, and shearing operations. Learn how these mathematical operations enable the simulation of movement and manipulation of objects on the plane, essential for various co
0 views • 16 slides
Understanding Vector Graphics in Computer Graphics
Vector graphics in computer graphics are defined by 2D points connected by lines and curves to form shapes. Commonly found in SVG, EPS, PDF, or AI formats, they differ from raster graphics like JPEG or PNG. The W3C standard for vector graphics is SVG, allowing scalable and resolution-independent ima
0 views • 4 slides
Introduction to Data Analysis in Geophysics using MATLAB Graphics Handles
Practice interactive input, file reading, and plotting in MATLAB Graphics Handles lab. Explore ways to improve graphics in Geophysics data analysis. Learn basic histogram plot representation with properties and understand the functionalities provided in MATLAB for handling geophysical data through g
0 views • 21 slides
Statistical Tools for Method Validation in USP General Chapter 1210
In the USP General Chapter 1210, Statistical Tools for Method Validation are outlined, serving as a companion to the validation of Compendial Procedures. The chapter covers important topics like Accuracy, Precision, Linearity, LOD, LOQ, and range. It emphasizes statistical tools such as TOST, statis
0 views • 22 slides
