Understanding Dummy Variables in Regression Analysis
Dummy variables are essential in regression analysis to quantify qualitative variables that influence the dependent variable. They represent attributes like gender, education level, or region with binary values (0 or 1). Econometricians use dummy variables as proxies for unmeasurable factors. These
3 views • 19 slides
Understanding Machine Learning Concepts: Linear Classification and Logistic Regression
Explore the fundamentals of machine learning through concepts such as Deterministic Learning, Linear Classification, and Logistic Regression. Gain insights on linear hyperplanes, margin computation, and the uniqueness of functions found in logistic regression. Enhance your understanding of these key
6 views • 62 slides
Understanding Multiple Linear Regression: An In-Depth Exploration
Explore the concept of multiple linear regression, extending the linear model to predict values of variable A given values of variables B and C. Learn about the necessity and advantages of multiple regression, the geometry of best fit when moving from one to two predictors, the full regression equat
4 views • 31 slides
Understanding Multicollinearity in Regression Analysis
Multicollinearity in regression occurs when independent variables have strong correlations, impacting coefficient estimation. Perfect multicollinearity leads to regression model issues, while imperfect multicollinearity affects coefficient estimation. Detection methods and consequences, such as incr
1 views • 11 slides
Comparing Logit and Probit Coefficients between Models
Richard Williams, with assistance from Cheng Wang, discusses the comparison of logit and probit coefficients in regression models. The essence of estimating models with continuous independent variables is explored, emphasizing the impact of adding explanatory variables on explained and residual vari
1 views • 43 slides
Binary Logistic Regression with SPSS – A Comprehensive Guide by Karl L. Wuensch
Explore the world of Binary Logistic Regression with SPSS through an instructional document provided by Karl L. Wuensch of East Carolina University. Understand when to use this regression model, its applications in research involving dichotomous variables, and the iterative maximum likelihood proced
0 views • 87 slides
WHARTON RESEARCH DATA SERVICES OLS Regression in Python
This tutorial covers OLS regression in Python using Wharton Research Data Services. It includes steps to install required packages, read data into Python, fit a model, and output the results. The guide also demonstrates activating a virtual environment, installing necessary packages, and fitting a r
0 views • 14 slides
Understanding Proportional Odds Assumption in Ordinal Regression
Exploring the proportional odds assumption in ordinal regression, this article discusses testing methods, like the parallel lines test, comparing multinomial and ordinal logistic regression models, and when to use each approach. It explains how violating the assumption may lead to using the multinom
0 views • 13 slides
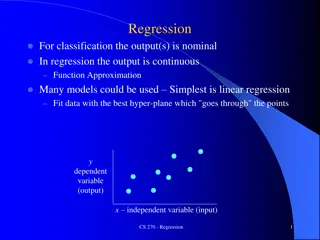
Understanding Regression in Machine Learning
Regression in machine learning involves fitting data with the best hyper-plane to approximate a continuous output, contrasting with classification where the output is nominal. Linear regression is a common technique for this purpose, aiming to minimize the sum of squared residues. The process involv
1 views • 34 slides
Understanding Regression Analysis in Social Sciences
Explore a practical regression example involving sales productivity evaluation in a software company. Learn how to draw scatterplots, estimate correlations, and determine significant relationships between sales calls and systems sold. Discover the process of predicting sales using regression analysi
1 views • 35 slides
Understanding Multiple Regression in Statistics
Introduction to multiple regression, including when to use it, how it extends simple linear regression, and practical applications. Explore the relationships between multiple independent variables and a dependent variable, with examples and motivations for using multiple regression models in data an
0 views • 19 slides
Overview of Linear Regression in Machine Learning
Linear regression is a fundamental concept in machine learning where a line or plane is fitted to a set of points to model the input-output relationship. It discusses fitting linear models, transforming inputs for nonlinear relationships, and parameter estimation via calculus. The simplest linear re
0 views • 14 slides
Understanding Joule-Thomson Coefficient in Thermodynamics
The Joule-Thomson coefficient describes the relationship between temperature and pressure changes in a substance. This coefficient impacts the direction of temperature change when pressure is altered. With equations and explanations provided by U. Nithya, M.Sc., M.Phil., this summary covers the defi
2 views • 11 slides
Understanding Least-Squares Regression Line in Statistics
The concept of the least-squares regression line is crucial in statistics for predicting values based on two-variable data. This regression line minimizes the sum of squared residuals, aiming to make predicted values as close as possible to actual values. By calculating the regression line using tec
0 views • 15 slides
Understanding Regression Analysis: Meaning, Uses, and Applications
Regression analysis is a statistical tool developed by Sir Francis Galton to measure the relationship between variables. It helps predict unknown values based on known values, estimate errors, and determine correlations. Regression lines and equations are essential components of regression analysis,
0 views • 10 slides
Introduction to Binary Logistic Regression: A Comprehensive Guide
Binary logistic regression is a valuable tool for studying relationships between categorical variables, such as disease presence, voting intentions, and Likert-scale responses. Unlike linear regression, binary logistic regression ensures predicted values lie between 0 and 1, making it suitable for m
7 views • 17 slides
Understanding Correlation and Regression in Data Analysis
Correlation and Regression play vital roles in investigating relationships between quantitative variables. Pearson's r correlation coefficient measures the strength of association between variables, whether positive or negative, linear or non-linear. Learn about different types of correlation, such
0 views • 26 slides
Understanding Linear Regression: Concepts and Applications
Linear regression is a statistical method for modeling the relationship between a dependent variable and one or more independent variables. It involves estimating and predicting the expected values of the dependent variable based on the known values of the independent variables. Terminology and nota
0 views • 30 slides
Understanding Binary Logistic Regression and Its Importance in Research
Binary logistic regression is an essential statistical technique used in research when the dependent variable is dichotomous, such as yes/no outcomes. It overcomes limitations of linear regression, especially when dealing with non-normally distributed variables. Logistic regression is crucial for an
0 views • 20 slides
Understanding Partition Coefficient in Pharmaceuticals
Partition coefficient (P.C.) is crucial in pharmaceuticals for various reasons such as preserving oil/water systems, drug distribution in the body, extraction processes, and dosage form formulations. It involves the distribution of a solute between two immiscible liquids based on equilibrium express
0 views • 10 slides
Understanding Pearson Product-Moment Correlation Coefficient
Pearson product-moment correlation coefficient, denoted by "r," is a numerical measure of the strength and direction of a linear relationship between two variables. It ranges from -1 to +1, where 1 signifies a perfect positive linear correlation, -1 a perfect negative linear correlation, and 0 no co
0 views • 18 slides
Arctic Sea Ice Regression Modeling & Rate of Decline
Explore the rate of decline of Arctic sea ice through regression modeling techniques. The presentation covers variables, linear regression, interpretation of scatterplots and residual plots, quadratic regression, and the comparison of models. Discover the decreasing trend in Arctic sea ice extent si
1 views • 9 slides
Understanding Overdispersed Data in SAS for Regression Analysis
Explore the concept of overdispersion in count and binary data, its causes, consequences, and how to account for it in regression analysis using SAS. Learn about Poisson and binomial distributions, along with common techniques like Poisson regression and logistic regression. Gain insights into handl
0 views • 61 slides
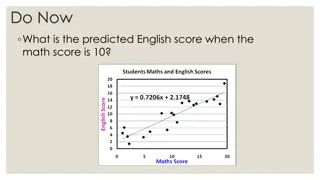
Understanding Regression Lines for Predicting English Scores
Learn how to utilize regression lines to predict English scores based on math scores, recognize the dangers of extrapolation, calculate and interpret residuals, and understand the significance of slope and y-intercept in regression analysis. Explore the process of making predictions using regression
0 views • 34 slides
Conditional and Reference Class Linear Regression: A Comprehensive Overview
In this comprehensive presentation, the concept of conditional and reference class linear regression is explored in depth, elucidating key aspects such as determining relevant data for inference, solving for k-DNF conditions on Boolean and real attributes, and developing algorithms for conditional l
0 views • 33 slides
Exploring Curve Fitting and Regression Techniques in Neural Data Analysis
Delve into the world of curve fitting and regression analyses applied to neural data, including topics such as simple linear regression, polynomial regression, spline methods, and strategies for balancing fit and smoothness. Learn about variations in fitting models and the challenges of underfitting
0 views • 33 slides
Understanding Linear Regression and Gradient Descent
Linear regression is about predicting continuous values, while logistic regression deals with discrete predictions. Gradient descent is a widely used optimization technique in machine learning. To predict commute times for new individuals based on data, we can use linear regression assuming a linear
0 views • 30 slides
Understanding Multiclass Logistic Regression in Data Science
Multiclass logistic regression extends standard logistic regression to predict outcomes with more than two categories. It includes ordinal logistic regression for hierarchical categories and multinomial logistic regression for non-ordered categories. By fitting separate models for each category, suc
0 views • 23 slides
Understanding Correlation Coefficient and Line of Best Fit
Learn how to find the correlation coefficient and create a line of best fit using statistical and regression calculations. Discover the steps involved, from setting up the calculator to analyzing the input data and determining the correlation between variables.
0 views • 14 slides
Methods for Handling Collinearity in Linear Regression
Linear regression can face issues such as overfitting, poor generalizability, and collinearity when dealing with multiple predictors. Collinearity, where predictors are linearly related, can lead to unstable model estimates. To address this, penalized regression methods like Ridge and Elastic Net ca
0 views • 70 slides
VIIRS Land Surface Temperature (LST) Calibration Approach and Data Analysis
The VIIRS Land Surface Temperature (LST) Provisional Status project, led by Dr. Yunyue Yu, focuses on improving the LST EDR through algorithm coefficient updates and calibrations. The calibration process involves regression steps and comparisons with reference datasets like MODIS Aqua LST. Various c
0 views • 29 slides
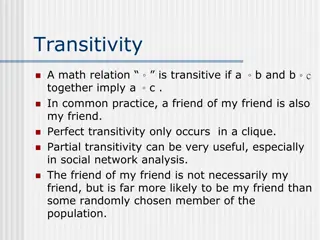
Understanding Transitivity and Clustering Coefficient in Social Networks
Transitivity in math relations signifies a chain of connectedness where the friend of a friend might likely be one's friend, particularly in social network analysis. The clustering coefficient measures the likelihood of interconnected nodes and their relationships in a network, highlighting the stru
0 views • 8 slides
Understanding Regression Analysis in Statistical Research
Regression analysis, specifically focusing on the R2 statistic, is a method used to examine the relationship between two variables at an interval/ratio level. It evaluates how well a line fits the data and measures the strength of the relationship between independent and dependent variables. Being s
0 views • 5 slides
Understanding Linear Regression Analysis: Testing for Association Between X and Y Variables
The provided images and text explain the process of testing for association between two quantitative variables using Linear Regression Analysis. It covers topics such as estimating slopes for Least Squares Regression lines, understanding residuals, conducting T-Tests for population regression lines,
0 views • 26 slides
Data Analysis and Regression Quiz Overview
This quiz covers topics related to traditional OLS regression problems, generalized regression characteristics, JMP options, penalty methods in Elastic Net, AIC vs. BIC, GINI impurity in decision trees, and more. Test your knowledge and understanding of key concepts in data analysis and regression t
0 views • 14 slides
Understanding Survival Analysis: Hazard Function and Cox Regression
Survival analysis examines hazards, such as the risk of events occurring over time. The Hazard Function and Cox Regression are essential concepts in this field. The Hazard Function assesses the risk of an event in a short time interval, while Cox Regression, named after Sir David Cox, estimates the
0 views • 20 slides
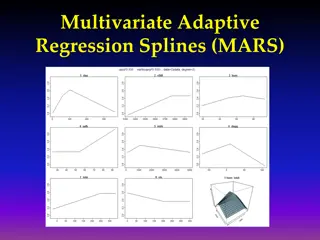
Understanding Multivariate Adaptive Regression Splines (MARS)
Multivariate Adaptive Regression Splines (MARS) is a flexible modeling technique that constructs complex relationships using a set of basis functions chosen from a library. The basis functions are selected through a combination of forward selection and backward elimination processes to build a smoot
0 views • 13 slides
Multivariate Adaptive Regression Splines (MARS) in Machine Learning
Multivariate Adaptive Regression Splines (MARS) offer a flexible approach in machine learning by combining features of linear regression, non-linear regression, and basis expansions. Unlike traditional models, MARS makes no assumptions about the underlying functional relationship, leading to improve
0 views • 42 slides
Introduction to Machine Learning: Model Selection and Error Decomposition
This course covers topics such as model selection, error decomposition, bias-variance tradeoff, and classification using Naive Bayes. Students are required to implement linear regression, Naive Bayes, and logistic regression for homework. Important administrative information about deadlines, mid-ter
0 views • 42 slides
Exploring Pitcher's ERA and Strikeout Relationship in Baseball
An analysis was conducted to investigate the relationship between a Major League pitcher's Earned Run Average (ERA) and the number of strikeouts during the 2018 regular season. Using a simple random sample of 30 pitchers, a correlation coefficient of -0.376 was found, indicating a moderately weak ne
0 views • 10 slides


