Understanding Regression Analysis: Meaning, Uses, and Applications
Regression analysis is a statistical tool developed by Sir Francis Galton to measure the relationship between variables. It helps predict unknown values based on known values, estimate errors, and determine correlations. Regression lines and equations are essential components of regression analysis, providing insights into dependent and independent variables. This analysis is widely used in economics, business research, and other fields to study cause-and-effect relationships.
Download Presentation

Please find below an Image/Link to download the presentation.
The content on the website is provided AS IS for your information and personal use only. It may not be sold, licensed, or shared on other websites without obtaining consent from the author. Download presentation by click this link. If you encounter any issues during the download, it is possible that the publisher has removed the file from their server.
E N D
Presentation Transcript
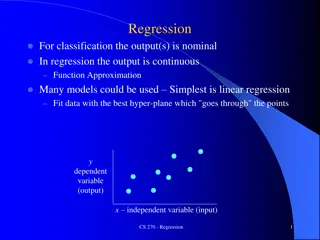
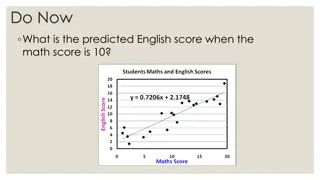
Meaning: A study of measuring the relationship between associated variables, wherein one variable is dependent on another independent variable, called as Regression. It is developed by Sir Francis Galton in 1877 to measure the relationship of height between parents and their children. Regression analysis is a statistical tool to study the nature and extent of functional relationship between two or more variables and to estimate (or predict) the unknown values of dependent variable from the known values of independent variable. The variable that forms the basis for predicting another variable is known as the Independent Variable and the variable that is predicted is known as dependent variable. For example, if we know that two variables price (X) and demand (Y) are closely related we can find out the most probable value of X for a given value of Y or the most probable value of Y for a given value of X. Similarly, if we know that the amount of tax and the rise in the price of a commodity are closely related, we can find out the expected price for a certain amount of tax levy.
Uses of Regression Analysis: 1. It provides estimates of values of the dependent variables from values of independent variables. 2. It is used to obtain a measure of the error involved in using the regression line as a basis for estimation. 3. With the help of regression analysis, we can obtain a measure of degree of association or correlation that exists between the two variables. 4. It is highly valuable tool in economies and business research, since most of the problems of the economic analysis are based on cause and effect relationship.
Regression Lines and Regression Equation: Regression lines and regression equations are used synonymously. Regression equations are algebraic expression of the regression lines. Let us consider two variables: X & Y. If y depends on x, then the result comes in the form of simple regression. If we take the case of two variable X and Y, we shall have two regression lines as the regression line of X on Y and regression line of Y on X. The regression line of Y on X gives the most probable value of Y for given value of X and the regression line of X on Y given the most probable value of X for given value of Y. Thus, we have two regression lines. However, when there is either perfect positive or perfect negative correlation between the two variables, the two regression line will coincide, i.e. we will have one line. If the variables are independent, r is zero and the lines of regression are at right angles i.e. parallel to X axis and Y axis. Therefore, with the help of simple linear regression model we have the following two regression lines.
1. Regression line of Y on X: This line gives the probable value of Y (Dependent variable) for any given value of X (Independent variable). Regression line of Y on X : Y = byx (X ) OR : Y = a + bX 2. Regression line of X on Y: This line gives the probable value of X (Dependent variable) for any given value of Y (Independent variable). Regression line of X on Y : X = bxy (Y ) OR : X = a + bY
In the above two regression lines or regression equations, there are two regression parameters, which are a and b . Here a is unknown constant and b which is also denoted as byx or bxy , is also another unknown constant popularly called as regression coefficient. Hence, these a and b are two unknown constants (fixed numerical values) which determine the position of the line completely. If the value of either or both of them is changed, another line is determined. The parameter a determines the level of the fitted line (i.e. the distance of the line directly above or below the origin). The parameter b determines the slope of the line (i.e. the change in Y for unit change in X).
If the values of constants a and b are obtained, the line is completely determined. But the question is how to obtain these values. The answer is provided by the method of least squares. With the little algebra and differential calculus, it can be shown that the following two normal equations, if solved simultaneously, will yield the values of the parameters a and b .
This above method is popularly known as direct method, which becomes quite cumbersome when the values of X and Y are large. This work can be simplified if instead of dealing with actual values of X and Y, we take the deviations of X and Y series from their respective means. In that case: Regression equation Y on X: Y = a + bX will change to (Y ) = byx (X ) Regression equation X on Y: X = a + bY will change to (X ) = bxy (Y ) In this new form of regression equation, we need to compute only one parameter i.e. b . This b which is also denoted either byx or bxy which is called as regression coefficient.
Regression Coefficient: The quantity b in the regression equation is called as the regression coefficient or slope coefficient. Since there are two regression equations, therefore, we have two regression coefficients. 1. Regression Coefficient X on Y, symbolically written as bxy 2. Regression Coefficient Y on X, symbolically written as byx
