
Understanding Data Visualization in Healthcare
This session explores the importance of data visualization in healthcare, focusing on analyzing opportunities and challenges in utilizing data for decision-making. It covers the process, audience considerations, historical examples, and real-world applications like COVID-19 statistics and child grow
1 views • 31 slides

Why Most Data Visualization Dashboards Fail — And How to Make Yours Succeed
Embrace the opportunity to see how Grow can transform your business data visualization strategy with a 14-day free trial.
2 views • 4 slides

Understanding Data Visualization with Matplotlib in Python
Matplotlib is a powerful Python package for data visualization, offering both an integrated interface (pyplot) and a native object-oriented interface. This tool enables users to create various types of plots and gives control over the visualization process. Learn about basic operations, differences
6 views • 19 slides

DCU Power BI 101 Guide for End Users: Interactive Data Visualization Software
Learn about Power BI, an interactive data visualization software by Microsoft, focusing on business intelligence. The guide covers getting started, differences between Service and Desktop versions, and troubleshooting tips. Explore downloading reports, visuals, and summary data, enhancing your data
1 views • 13 slides
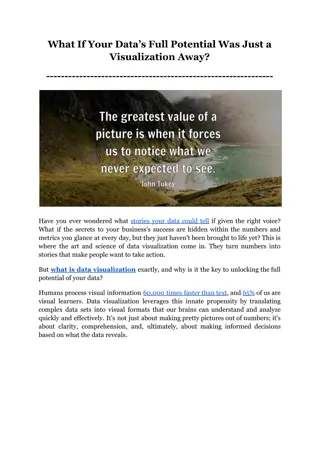
What If Your Data’s Full Potential Was Just a Visualization Away_
Discover what is data visualization and how it can reveal your data\u2019s full potential, guiding you towards more informed decisions and a brighter business future. Let\u2019s dive right in!
0 views • 6 slides
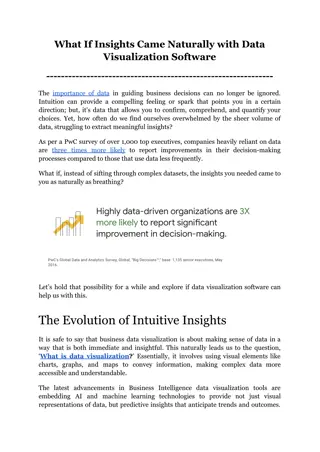
What If Insights Came Naturally with Data Visualization Software
In an era where data is as vital as currency, the power to swiftly unlock and act on its hidden insights could be the key to unlocking unprecedented growth and innovation. Imagine a world where data visualization software not only presents data but intuitively guides you to the insights buried withi
1 views • 6 slides
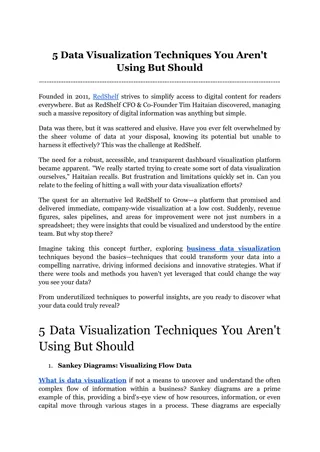
5 Data Visualization Techniques You Aren't Using But Should
\nUnlock the potential of your data with our exploration into innovative business data visualization methods that go beyond the basics.
1 views • 5 slides

Open Source Chat Based Data Visualization With Helical Insight
Open Source Chat Based Data Visualization plays a pivotal role in modern business operations, enabling organizations to derive insights, make informed decisions, and drive growth. However, traditional visualization tools often come with high costs and steep learning curves, limiting accessibility an
1 views • 2 slides
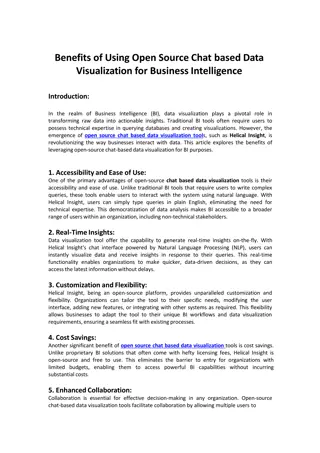
Benefits of Open Source Chat-based Data Visualization
In the realm of Business Intelligence (BI), data visualization plays a pivotal role in transforming raw data into actionable insights. Traditional BI tools often require users to possess technical expertise in querying databases and creating visualizations. However, the emergence of open source chat
1 views • 2 slides
Open Source Alternative to Tableau for Data Visualization in 2024
As businesses increasingly rely on data-driven decisions, the demand for powerful data visualization tools continues to grow. Tableau has long been a leader in this space, known for its robust capabilities and user-friendly interface. However, open-source alternatives are gaining traction due to the
0 views • 2 slides

Analysis of Gender Pay Gap Reporting at Oxford Health NHS FT as of March 2019
The Gender Pay Gap report at Oxford Health NHS FT covers key aspects including mean and median gender pay gaps in hourly pay, bonus gaps, proportion of employees receiving bonuses, and proportion of males and females in each pay quartile. The report also highlights workforce gender distribution, Age
0 views • 17 slides
Converting Measurements using Ratio in Math Education
Explore the concept of converting measurements using ratio in Math education. Learn how to convert between customary and metric units through multiplication or division, and solve problems with ratio and proportion. Discover key vocabulary like Customary Unit, Metric Unit, Conversion, Ratio, and Pro
1 views • 23 slides

Reusing Phylogenetic Data for Enhanced Visualization and Analysis
Reusing phylogenetic data can revolutionize scientific research by enabling synthesis of knowledge and comparative analyses across scientific disciplines. However, a significant portion of valuable phylogenetic data is lost due to the prevalent use of static images for tree publication. To address t
0 views • 8 slides

Understanding Wind Tunnels: Devices for Aerodynamic Testing
Wind tunnels are devices that simulate air flows to test models under controlled conditions. They are classified as low-speed and high-speed tunnels, used to replicate flying or moving objects. Testing involves studying air motion using techniques like smoke visualization, colored threads, and speci
2 views • 37 slides

Laws of Production in Economics
The content discusses the laws of production in economics, including the law of variable proportion in the short run and the law of returns to scale in the long run. It explains the concepts of total product, average product, and marginal product, along with the stages of production. The law of vari
0 views • 18 slides

Principles and Elements of Interior Design Explained
Explore the fundamental principles of interior design, including proportion, rhythm, emphasis, balance, scale, and harmony. Delve into the significance of scale, proportion, rhythm, emphasis, balance, and harmony in creating cohesive and visually appealing spaces. Discover how design elements like s
0 views • 18 slides
Understanding Pharmaceutical Product Strength Alteration
Exploring methods to adjust the strength of pharmaceutical preparations by manipulating the proportion of active ingredients, dilution, concentration, and the relationship between strength and total quantity. Learn about solving problems related to altering product strength using inverse proportion,
0 views • 17 slides

Interactive Plotting with ggplot and Shiny: Enhancing Galaxy Visualization Tools
Explore the concept of transforming existing ggplot2 Galaxy tools into interactive platforms using Shiny or Plotly implementations. Discover a variety of plot types available with ggplot2, such as barplots, violin plots, PCA plots, and heatmaps. Utilize additional plot options through various geom_*
1 views • 9 slides
Understanding Basic Concepts of Chemistry
Matter is defined as anything that occupies space and possesses mass. It can exist in three physical states: solid, liquid, and gas. Mass is the amount of matter in a substance, while weight is the force of gravity on an object. Temperature quantitatively expresses hot and cold, measured in Celsius,
4 views • 14 slides
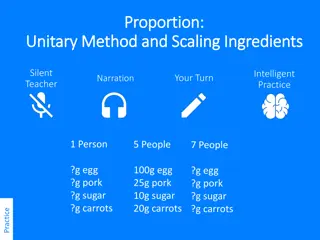
Proportion Method for Scaling Ingredients in Cooking
Explore the unitary method for scaling ingredients in cooking for different numbers of people. Practice with examples to understand how to adjust quantities based on the number of individuals you are cooking for. Enhance your cooking skills with intelligent practice using the proportion method.
0 views • 7 slides

EEG Conformer: Convolutional Transformer for EEG Decoding and Visualization
This study introduces the EEG Conformer, a Convolutional Transformer model designed for EEG decoding and visualization. The research presents a cutting-edge approach in neural systems and rehabilitation engineering, offering advancements in EEG analysis techniques. By combining convolutional neural
1 views • 6 slides
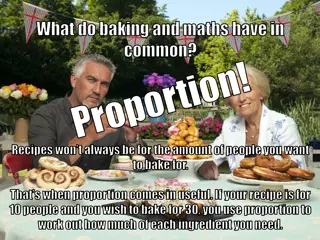
Baking Math: Proportion in Swiss Roll Recipe
Proportion plays a key role in adjusting recipe quantities for different servings in baking. Using the example of a Chocolate Fudge Swiss Roll, learn how to scale ingredients for different numbers of servings efficiently using math and proportion.
0 views • 5 slides

Statistical Analysis of Child Sexual Abuse in Australian Catholic Church Institutions
This analysis explores statistical issues arising from the Australian Royal Commission into Institutional Responses to Child Sexual Abuse, focusing on the reporting of proportions and potential double counting. It includes data on the overall proportion of alleged perpetrators in different religious
0 views • 26 slides

Design and Evaluation in Visualization Techniques
Understanding the importance of formal evaluations in visualization techniques, this material covers a range of evaluation methods including empirical and analytic approaches such as usability tests, controlled experiments, and expert reviews. It delves into the scientific method of hypothesis forma
1 views • 41 slides
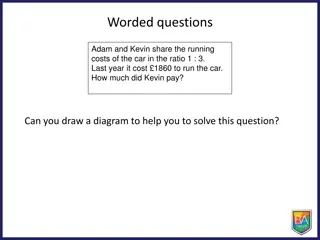
Ratio and Proportion Practice Questions and Solutions
Practice a variety of ratio and proportion problems involving sharing costs, making mixtures, determining quantities, and more. Solutions provided with helpful diagrams to visualize the problem-solving approach.
0 views • 11 slides
Multidimensional Icons in Data Visualization Solutions
This collection showcases various types of visual icons used in data visualization to represent values of different variables, such as categorical, quantitative, and Boolean data. Each icon summarizes specific information for a given item in a collection, ranging from nominal and ordinal data to the
0 views • 9 slides
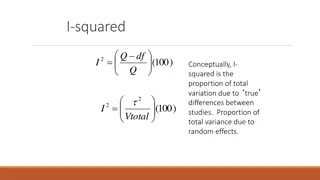
Understanding Prediction and Confidence Intervals in Meta-Analysis
Conceptually, I-squared represents the proportion of total variation due to true differences between studies, while Proportion of total variance is due to random effects. Prediction intervals provide a range where study outcomes are expected, unlike confidence intervals which contain the parameter's
0 views • 26 slides

Enhancing Safety in Navigation Through Improved Data Quality Visualization
The IHO Data Quality Working Group focuses on classifying and depicting the quality of digital hydrographic information to ensure safe navigation. The group addresses the need for clear warnings on ECDIS displays regarding poor-quality survey data. Despite progress in developing visualization method
0 views • 34 slides

Software Design Patterns for Information Visualization
Explore design patterns for information visualization interfaces, understand the complexities, and leverage tools like Google API. Learn about different software design patterns, categories of patterns for information visualization, and the relationships between them. Discover the reference model fo
0 views • 27 slides
Understanding Ratios and Proportions: A Comprehensive Guide
Explore the concepts of rate, ratio, and proportion with detailed examples and explanations. Learn how to express ratios as fractions and in words, find equivalent ratios, practice with equivalent ratios, and solve ratio and proportion problems. Discover the importance of ratios in various scenarios
0 views • 9 slides
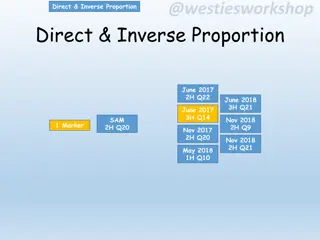
Understanding Direct and Inverse Proportion in Mathematics
Exploring the concept of direct and inverse proportion in mathematics through various questions from past exam papers. The content includes images illustrating how these proportional relationships work in different scenarios.
0 views • 24 slides

Interactive Data Visualization Tools and Techniques Quiz
This quiz tests knowledge on data visualization tools, techniques, and concepts. Questions cover topics such as the use of EDA in data visualization, interactive graph outputs, historical figures in data visualization, GIS data types in SAS/JMP, outlier detection in 3D scatterplots, and limitations
0 views • 11 slides
Cognition Models in InfoVis: Understanding Knowledge Creation Process
Visualization plays a key role in aiding cognition by supporting knowledge creation and seeking tasks through process models and task taxonomies. Understanding the cognitive aspects of information visualization is crucial for aiding comprehension and knowledge understanding, as demonstrated by the u
0 views • 41 slides
Understanding Revenue Requirements for Non-program Food Sales
Non-program food revenue plays a crucial role in school food service operations. Schools need to ensure that the revenue from non-program food sales meets a specified proportion to cover costs effectively. Failure to comply may result in corrective action during reviews by the state agency. To meet
0 views • 9 slides
Visualizing Lengths: Fun Learning Activities for Students
Experience engaging activities on measuring lengths and distances, comparing familiar objects, estimating lengths, visualizing proportions, and exploring real-world scenarios. The content includes explicit teaching on the length of a blue whale, constructing maps, measuring room dimensions, and fun
0 views • 12 slides
Teaching Compound Measures Using Ratio & Proportion
Explore the fascinating world of compound measures using ratio and proportion with Kathryn Darwin, Deputy Subject Leader of Maths at Manor Croft Academy, Dewsbury. Dive into sessions covering the challenges with triangles, speed calculations, prerequisites, bar models, ratio tables, unit changes, de
0 views • 25 slides
Enhancing Classmate's Data Visualization for Homework Assignment 2
Explore the process of applying a classmate's data visualization code to your own data for Homework Assignment 2. Critique the effectiveness of the visualization in conveying the intended point and offer suggestions for improvement if necessary. Follow the steps outlined to submit your completed ass
0 views • 4 slides
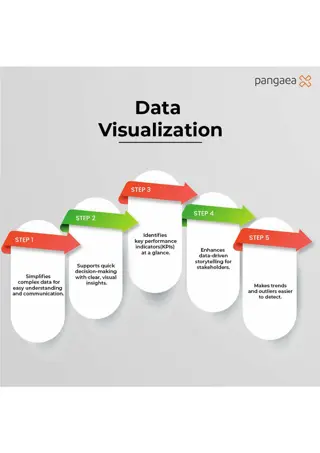
Maximize Business Impact with Data Visualization
This infographic shows how data visualization simplifies complex data, supports decision-making, highlights KPIs, and enhances data-driven storytelling. Its an essential tool for identifying trends and outliers. Discover expert data visualization talent at Pangaea X by visiting www.pangaeax.com.
6 views • 1 slides

Data Visualization Presentations Collection
Collection of various image slides containing charts, graphs, and data visualization elements. The slides showcase different types of visual representations such as bar graphs, line charts, percentages, and more. Each slide provides a unique visualization, making it a diverse collection for presenta
0 views • 13 slides
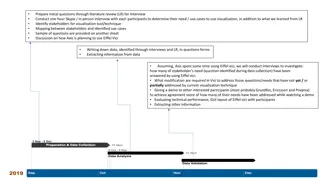
Effective Stakeholder Interviews for Visualization Tool Improvement
Conducting in-depth interviews with stakeholders is crucial for identifying their needs and use cases for visualization tools. By asking targeted questions and analyzing responses, insights can be gained to enhance the current visualization technique, like Eiffel Vici. The process involves mapping s
0 views • 5 slides