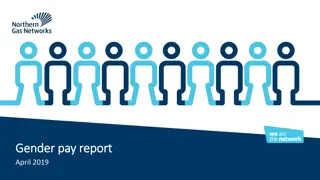
Analysis of Gender Pay Gap Reporting at Oxford Health NHS FT as of March 2019
The Gender Pay Gap report at Oxford Health NHS FT covers key aspects including mean and median gender pay gaps in hourly pay, bonus gaps, proportion of employees receiving bonuses, and proportion of males and females in each pay quartile. The report also highlights workforce gender distribution, Agenda for Change breakdown, and gender distribution across different job categories. The calculation of mean gender pay gap in hourly pay is explained with data showing the difference between male and female hourly rates across three consecutive years.

Download Presentation

Please find below an Image/Link to download the presentation.
The content on the website is provided AS IS for your information and personal use only. It may not be sold, licensed, or shared on other websites without obtaining consent from the author.If you encounter any issues during the download, it is possible that the publisher has removed the file from their server.
You are allowed to download the files provided on this website for personal or commercial use, subject to the condition that they are used lawfully. All files are the property of their respective owners.
The content on the website is provided AS IS for your information and personal use only. It may not be sold, licensed, or shared on other websites without obtaining consent from the author.
E N D
Presentation Transcript
Oxford Health NHS FT Gender Pay Gap Reporting As of 31 March 2019 Data to be published March 2020
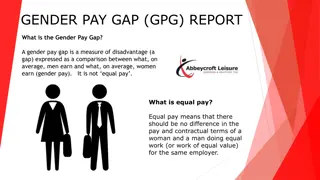
What does the Gender Pay Gap report cover? The purpose of a gender pay gap audit is to focus on comparing the pay of male and female employees and shows the difference in the average earnings. Mean gender pay gap in hourly pay Median gender pay gap in hourly pay Mean bonus gender pay gap Median bonus gender pay gap Proportion of males and females receiving a bonus payment Proportion of males and females in each pay quartile
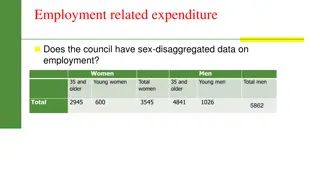
Our Workforce at OHFT As of 31st March 2019, the gender pay gap reporting analysis included 5,828 staff members. The gender split is as follows: Gender Headcount Proportion of Workforce Male 1176 20.2% Female 4652 79.8% In comparison to previous years: Male (1,176) 20.2% Male (1,095) 19.9% Male (982) 18.5% 2017 2018 2019 Female (4,340) 81.5% Female (4,417) 80.1% Female (4,652) 79.8% TOTAL 5,512 TOTAL 5,828 TOTAL 5,322
OHFT: Agenda for Change Gender breakdown Male 19% Female 81% 20.6% 28.2% 21.6% 10.8% 15.4% 14.4% 16.0% 20.4% 21.7% 24.0% Band 1 79.4% Band 2 71.8% Band 3 78.4% Band 4 89.2% Band 5 84.6% Band 6 85.6% Band 7 84.0% Band 8a 79.6% Band 8b 78.3% Band 8c 76.0% 44.4% 50.0% 41.2% Band 8d 55.6% Band 9 50.0% Non-AfC 58.8% 68.8% Board of Directors 31.2%
OHFT Gender breakdown Male Female Add prof scientific and Technical 17.5% 82.5% Additional clinical services 20.8% 79.2% Administrative and clerical 18.2% 81.8% 10.6% Allied health professionals 89.4% Estates and ancillary 35.6% 64.4% Medical and dental 47.5% 52.5% Nursing and midwifery registered 12.9% 87.1% Students 15.0% 85.0%
Who is included? For the measures: Mean gender pay gap in hourly pay Median gender pay gap in hourly pay We are required to include Full Pay Relevant Employees only. A Full Pay Relevant Employee is any employee who is employed on the snapshot date and who is paid their usual full basic pay (or pay for piecework) during the relevant pay period. If employees are being paid less than their usual basic pay or piecework rate, or nil, during the relevant pay period as a result of being on leave, then they are not a full pay relevant employee .
Mean Gender Pay Gap in hourly pay How is this calculated? The mean gender pay gap is the difference between the hourly pay of all male and all female employees when added up separately and divided respectively by the total number of males, and the total number of females in the workforce. Mean Hourly Rate Difference (between 2018 and 2019) Year to 31/3/17* Year to 31/3/18 Year to 31/3/19 Male 19.36 21.71 + 0.42 22.13 Female 16.10 16.93 + 0.53 17.46 Difference 3.26 4.78 + 0.11 4.67 Our Mean Hourly Pay Gap has decreased slightly 16.83% 22% -0.9% 21.1% Pay Gap % *Due to the more defined clarification on which staff groups should be included in this calculation our 2017 data has been revised, and therefore differs from the published figures.
Median Gender Pay Gap in hourly pay How is this calculated? The median pay gap is the difference between the pay of the middle male and the middle female, when all male employees and then all female employees are listed from the highest to the lowest paid. Median Hourly Rate Difference (between 2018 and 2019) Year to 31/3/17* Year to 31/3/18 Year to 31/3/19 Male 15.11 15.64 + 0.88 16.52 Female 14.58 14.80 + 0.56 15.36 Difference 0.52 0.84 + 0.31 1.15 Our Median Hourly Pay Gap has increased slightly Pay Gap % 3.46% 5.4% +1.6% 7.0% *Due to the more defined clarification on which staff groups should be included in this calculation our 2017 data has been revised, and therefore differs from the published figures.
Gender Pay Gap in hourly pay It is crucial to emphasise this does not mean that a male and a female staff member doing equal work receive different levels of pay. The headline Gender Pay Gap figures are: Mean: 21.1% Median: 7.0% However if we look at contract type it is easy to identify that this figure is skewed by Directors and Flexible Workers. Excluding the 108 people in these groups (which represents 1.9% of the Trust workforce) we see a reduction in the Gender Pay Gap to 14.7%. If we look at data only for staff employed under the Agenda for Change terms & conditions, the mean gender pay gaps is 3.7% and for Medics is 4.3%
What is included? As part of the Gender Pay Gap, we are required to report on the mean and median bonus pay gap. Bonus pay is defined as any remuneration that is in the form of money, vouchers, securities or options and relates to profit sharing, productivity, performance, incentive or commission. Within the NHS, Bonus Pay in the context of the GPG refers to these payments: Local Clinical Excellence Awards Workplace vouchers in addition to salary National Clinical Excellence Awards Recruitment bonus one off VSM earn-back and performance related pay Long service award monetary or voucher Relocation costs in excess of expenses However, Clinical Excellence Awards account for all bonus payments recorded within OHFT. Please see next page for summary of these payments.
Proportion of males and females receiving a bonus payment How is this calculated? Total males and females receiving a bonus payment divided by the number of relevant employees Total eligible Employees (Permanent Medical Consultants) % of eligible employees receiving bonus Total % of total workforce receiving bonus number of Employees in Workforce Employees Paid Bonus Gender Female 38 65 58.5% 4,340 0.88% Year to 31/3/17 Male 27 50 54% 982 2.74% Female 41 62 66.1% 4,417 0.93% Year to 31/3/18 Male 37 55 67.3% 1,095 3.38% Female 28 55 51.0% 4,652 0.60% Year to 31/3/19 Male 32 56 57.1% 1,176 2.72%
Mean and Median Bonus Pay Gap Mean Bonus Pay Difference (between 2018 and 2019) - 676.51 257.53 - 934.05 -3.26% Year to 31/3/17 Year to 31/3/18 Year to 31/3/19 Male Female Difference Pay Gap % 17,613.63 8,133.04 9,480.59 53.83% 16,745.90 6,452.39 10,293.51 61.5% 16,069.39 6,709.92 9,359.46 58.24% Our Mean Bonus Pay Gap has decreased Median Bonus Pay Difference (between 2018 to 2019) - 8.30 + 1,427.49 - 1,435.79 Year to 31/3/17 Year to 31/3/18 Year to 31/3/19 Male Female Difference 11,934.30 4,167.93 7,766.38 11,764.80 3,666.47 8,098.33 11,756.50 5,093.96 6,662.54 Our Median Bonus Pay Gap has decreased Pay Gap % 65.08% 68.8% -12.1% 56.67%
Proportion of males and females in each pay quartile How is this calculated? Ranking all of our employees from highest to lowest paid, dividing this into four equal parts (quartiles) and working out the percentage of men and women in each of the four parts. (Q1=low, Q4=high). Male 19.12% Female 80.88% Male 16.74% Female 83.26% Quartile 1 Quartile 2 Male 27.30% Female 72.70% Male 17.43% Female 82.57% Quartile 3 Quartile 4
GPG: Comparisons to other BOB Trusts Please note data for year to 31/3/19 isn t available for the majority of Trusts. This information is to be published by 30 March 2020. Mean Year to 31/3/18 22% Median Year to 31/3/18 5.4% Year to 31/3/17 16.83% Year to 31/3/17 3.46% Year to 31/3/19 21.1% Year to 31/3/19 7.0% Trust Oxford Health Berkshire Healthcare Buckinghamshire Healthcare Oxford University Hospitals Royal Berkshire 20.76% 20.3% NYP 13.72% 14.17% NYP 29.6% 29.3% NYP 12.1% 15.0% NYP 26.0% 26.6% NYP 10.9% 15.2% NYP 24.85% 25.70% 25.98% 13% 12.63% 9.32% South Central Ambulance Service 5.1% 3.98% NYP 2.9% 1.43% NYP NYP = Not Yet Published
Hourly Pay: Comparisons to other BOB Trusts Please note data for year to 31/3/19 isn t yet available for the majority of Trusts. This information is to be published by 30 March 2020. 30 Percentage mean gender pay gap 25 20 15 10 5 0 1/1/2017 1/1/2018 1/1/2019 Oxford Health OUH Berkshire Healthcare Royal Berkshire Bucks Healthcare SCAS
Bonus Pay: Comparisons to other BOB Trusts Please note data for year to 31/3/19 isn t available for the majority of Trusts. This information is to be published by 30 March 2020. Mean Year to 31/3/18 61.5% Median Year to 31/3/18 68.8% Year to 31/3/17 53.83% Year to 31/3/17 65.08% Year to 31/3/19 58.24% Year to 31/3/19 56.67% Trust Oxford Health Berkshire Healthcare 15.36% 43.63% NYP 20.0% 20.0% NYP Buckinghamshire Healthcare Oxford University Hospitals Royal Berkshire 31.2% 87.0% NYP 0.1% 33.3% NYP 64.3% 76.6% NYP 75.5% 88.4% NYP 42.43% 32.87% 55.5% 33.33% South Central Ambulance Service 2.42% 16.64% NYP 8.65% 13.8% NYP NYP = Not Yet Published
Gender Equality Action Plan Our first Gender Equality Action plan has been drafted and works to: Ensure gender diversity balance on decision making forums Ensure our Gender Pay Gap report is published and discussed To increase awareness of gender equality to leaders and senior managers Establish a Gender Equality Staff Network group for all to work alongside the staff networks on race, disability and LGBT issues. To continue and further develop discussions raised from the 2019 Gender Equality Linking Leaders conferences Build on the Menopause awareness work started at the Linking Leader programmes in 2019, using the wellbeing champions. Embed support for staff relating to other Gender specific issues Ensure that recruitment and selection practices are inclusive for all prospective applicants regardless of gender Overhaul Flexible working policy to make flexible working absolutely normal and not a privilege to be granted or withheld