Open Source Alternative to Tableau for Data Visualization in 2024
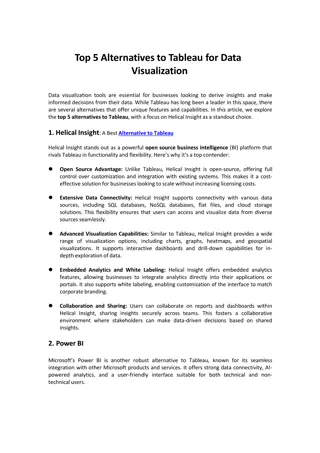
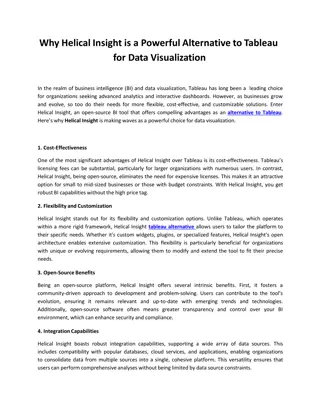
As businesses increasingly rely on data-driven decisions, the demand for powerful data visualization tools continues to grow. Tableau has long been a leader in this space, known for its robust capabilities and user-friendly interface. However, open-source alternatives are gaining traction due to their flexibility, cost-effectiveness, and community-driven enhancements. Among these, Helical Insight stands out as a premier choice. In this article, we explore why Helical Insight is the best open source alternative to Tableau for data visualization in 2024.
Download Presentation

Please find below an Image/Link to download the presentation.
The content on the website is provided AS IS for your information and personal use only. It may not be sold, licensed, or shared on other websites without obtaining consent from the author.If you encounter any issues during the download, it is possible that the publisher has removed the file from their server.
You are allowed to download the files provided on this website for personal or commercial use, subject to the condition that they are used lawfully. All files are the property of their respective owners.
The content on the website is provided AS IS for your information and personal use only. It may not be sold, licensed, or shared on other websites without obtaining consent from the author.
E N D
Presentation Transcript
Top Open Source Alternative to Tableau for Data Visualization in 2024: Helical Insight As businesses increasingly rely on data-driven decisions, the demand for powerful data visualization tools continues to grow. Tableau has long been a leader in this space, known for its robust capabilities and user-friendly interface. However, open-source alternatives are gaining traction due to their flexibility, cost-effectiveness, and community-driven enhancements. Among these, Helical Insight stands out as a premier choice. In this article, we explore why Helical Insight is the best open source alternative to Tableau for data visualizationin 2024. IntroductiontoHelicalInsight Helical Insight is an open-source Business Intelligence (BI) tool that empowers users to create, manage, and share insightful data visualizations. It is designed to cater to the needs of both technical and non-technical users, offering a seamless experience for data analysis and reporting. The platform's versatility, combined with its innovative features, makes it a compellingchoicefororganizationsseekinga powerfulalternativeto Tableau. KeyFeaturesofHelical Insight 1. Open SourceChat-BasedReporting One of the most innovative aspects of Helical Insight is its chat-based reporting functionality. This feature allows users to generate complex reports and visualizations simply by typing natural language queries. This intuitive interface democratizes data access, enabling users with varying technical expertiseto derive meaningfulinsights quickly and effortlessly. 2. ExtensiveCustomization As an open-source tool, Helical Insight offers unparalleled customization options. Users can modify the source code to tailor the platform to their specific requirements. Whether it's creating custom visualizations,integrating new data sources, or developing unique analytical functions,Helical Insightprovidestheflexibility toadaptto any businessneed. 3. Wide Range of DataConnectors Helical Insight supports a broad spectrum of data sources, including relational databases (MySQL, PostgreSQL), NoSQL databases (MongoDB, Cassandra), cloud services, and APIs. This wide range of connectivity options ensures that businesses can easily integrate their existing data infrastructure with Helical Insight, facilitating seamless data management and analysis. 4. AdvancedAnalyticsand Visualization The platform comes equipped with a comprehensive set of analytical and visualization tools. Users can perform detailed data exploration, create interactive dashboards, and generate insightful reports. Helical Insight s advanced visualization capabilities, including charts, graphs, maps, and more, enable users to present data in a compelling and understandable manner.
5. Robust SecurityFeatures Security is a critical concern for any data tool. Helical Insight offers robust security features, including role-based access control, data encryption, and secure data storage. These features ensure that sensitive information is protected and accessible only to authorized users. Benefits ofChoosing Helical Insight OverTableau 1. Cost-Effectiveness Being an open-source tool, Helical Insight significantly reduces the cost associated with data visualization and BI. Organizations can leverage its powerful features without the hefty licensing fees associated with commercial tools like Tableau. This cost-effectiveness makes HelicalInsightan ideal choiceforstartups,small businesses,andlarge enterprisesalike. 2. CommunitySupport andDevelopment Helical Insight benefits from a vibrant open-source community. This community-driven approach fosters continuous improvement and innovation, ensuring that the platform evolves with the latest trends and technologies. Users can contribute to the development, report issues, and collaborate on enhancements, driving a dynamic and supportive ecosystem. 3. Flexibilityand Adaptability The open-source nature of Helical Insight allows for extensive customization and integration. Businesses can tailor the platform to their specific needs, ensuring that it aligns perfectly with their data strategy. This flexibility is often limited in commercial tools like Tableau, where usersmustworkwithinpredefined constraints. 4. Easeof Use With its intuitive interface and chat-based reporting, Helical Insight is accessible to users with varying levels of technical expertise. This ease of use ensures that more employees can engage withdata,fostering a cultureof data-driven decision-makingacrossthe organization. Conclusion In the evolving landscape of data visualization, Helical Insight emerges as the best open- source alternative to Tableau in 2024. Its innovative features, cost-effectiveness, extensive customization options, and robust community support make it a powerful tool for any organization looking to harness the power of their data. Whether you are a small business or a large enterprise, Helical Insight offers the flexibility and capabilities to meet your data visualizationneeds effectively.
