Reusing Phylogenetic Data for Enhanced Visualization and Analysis
Reusing phylogenetic data can revolutionize scientific research by enabling synthesis of knowledge and comparative analyses across scientific disciplines. However, a significant portion of valuable phylogenetic data is lost due to the prevalent use of static images for tree publication. To address this issue, a paradigm shift towards serialized data objects containing tree information, associated data, and visualization directives is proposed. This approach allows for dynamic visualization and reuse of phylogenetic information for more impactful research outcomes.
Download Presentation

Please find below an Image/Link to download the presentation.
The content on the website is provided AS IS for your information and personal use only. It may not be sold, licensed, or shared on other websites without obtaining consent from the author.If you encounter any issues during the download, it is possible that the publisher has removed the file from their server.
You are allowed to download the files provided on this website for personal or commercial use, subject to the condition that they are used lawfully. All files are the property of their respective owners.
The content on the website is provided AS IS for your information and personal use only. It may not be sold, licensed, or shared on other websites without obtaining consent from the author.
E N D
Presentation Transcript
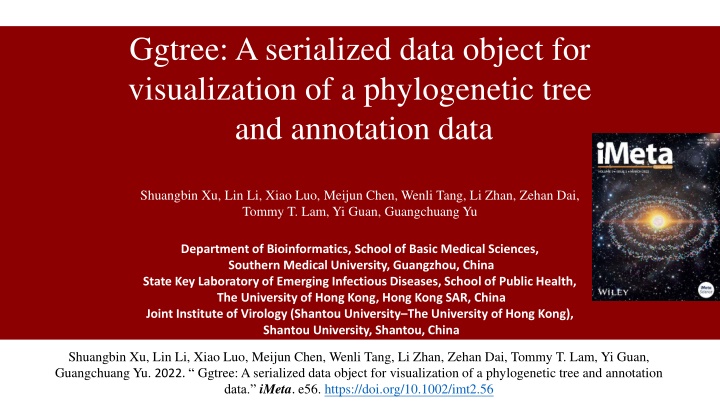
Ggtree: A serialized data object for visualization of a phylogenetic tree and annotation data Shuangbin Xu, Lin Li, Xiao Luo, Meijun Chen, Wenli Tang, Li Zhan, Zehan Dai, Tommy T. Lam, Yi Guan, Guangchuang Yu Department of Bioinformatics, School of Basic Medical Sciences, Southern Medical University, Guangzhou, China State Key Laboratory of Emerging Infectious Diseases, School of Public Health, The University of Hong Kong, Hong Kong SAR, China Joint Institute of Virology (Shantou University The University of Hong Kong), Shantou University, Shantou, China Shuangbin Xu, Lin Li, Xiao Luo, Meijun Chen, Wenli Tang, Li Zhan, Zehan Dai, Tommy T. Lam, Yi Guan, Guangchuang Yu. 2022. Ggtree: A serialized data object for visualization of a phylogenetic tree and annotation data. iMeta. e56. https://doi.org/10.1002/imt2.56
Introduction / Results Phylogenetic tree + Associated data Microbiome Epidemiology Ecology https://www.eden.gov.uk/your-environment/zero-carbon-eden/ecology-and-biodiversity/ https://www.azolifesciences.com/article/What-is-Epidemiology.aspx https://www.niehs.nih.gov/health/topics/science/microbiome/index.cfm
Introduction Reusing phylogenetic data can contribute to synthesize phylogenetic knowledge and comparative analyses in a number of scientific disciplines. Problems But ~60% of published phylogenetic data are lost to science forever [1]. This is because phylogenetic trees are often published as static images and lack of interoperable file format for data sharing [2]. Although tools for tree visualization and annotation are proliferating, the dominant objective remains to produce a publication-ready figure, which involves multiple steps in selecting the annotation data (e.g., bootstrap values) and rendering it on the tree (e.g., as text labels or branch colors). The process is one-way and a dead end to yield a static figure that the underlying information cannot be reused. How to solve the problems a paradigm shift from producing a static figure to a serialized data object that contains the tree, associated data and visualization directives in addition to render as a visualization graphic.
Results # Loading the required packages pacman::p_load(tidytree, treeio, ggplot2, ggtree) # The url of phylogenetic tree and associated data, # which can be replace user own files. url <- paste0("https://raw.githubusercontent.com/TreeViz/", "metastyle/master/design/viz_targets_exercise/") # parsing the phylogenetic tree files with # the functions of treeio package it will generate # phylo or treedata object. x <- read.tree(paste0(url, "tree_boots.nwk")) # reading the associated data d <- read.csv(paste0(url, "inode_data.csv")) # constructing the ggtree object (using ggtree function) and # adding associated data to the object (using %<+% function) p <- ggtree(x) %<+% d + # annotating tree with the posterior (in this example) or other data geom_nodepoint(aes(colour = posterior), size = 5) + # adjust the color of the data point annotated. scale_color_viridis_c() + # adjusting the theme of the object. theme(legend.position = 'right') Ggtree data object Phylogenetic tree + Associated data How to construct the object the object can be rendered a static figure. print(p)
Results ## extract tree from graphic object tree <- as.treedata(p) ## associated data is included in the tree object get.fields(tree) ## [1] "vernacularName" "infoURL" "rank" "bootstrap" ## [5] "posterior" ## convert graphic object to Newick text ## tree can be exported with associated data into ## a single file using write.beast write.tree(as.phylo(p)) ## [1] "(((Rangifer_tarandus:1,Cervus_elaphus:1)Cervidae:1,(Bos_taurus:1,Ovis_orient alis:1)Bovidae:1)Artiodactyla:1,(Suricata_suricatta:2,(Cystophora_cristata:1, Mephitis_mephitis:1)Caniformia:1)Carnivora:1)Mammalia;" Extracting phylogenetic tree from ggtree object y <- treedata(phylo = rtree(30), data = tibble(node = 31:59, posterior = rnorm(29, 0.8, .1))) p %<% y The ggtree object can be used to visualize new tree object, which is similar to Microsoft Word Format Painter.
Results info <- read.csv(paste0(url, "tip_data.csv")) p2 <- facet_plot(p, data = info[, c(1,7,8 )], geom = geom_col, mapping = aes(x=log(mass_in_kg)), orientation = 'y', panel = 'Mass') Using facet_plot to combine the associated data and ggtree object facet_data(p2, 'Mass') ## ## 1 Bos_taurus ## 2 Cervus_elaphus 240.87 herbivore ## 3 Cystophora_cristata 278.90 omnivore ## 4 Mephitis_mephitis 2.40 omnivore ## 5 Ovis_orientalis 39.10 herbivore ## 6 Rangifer_tarandus 109.09 herbivore ## 7 Suricata_suricatta 0.73 carnivore label mass_in_kg trophic_habit 618.64 herbivore Extracing the associated data added to object using facet_data.
Summary The phylogenetic tree and diverse accompanying data can be stored in a ggtree graph object, which improves the reproducibility and reusability of phylogenetic data. The phylogenetic tree and associated data can be extracted from the ggtree object, which can be reanalyzed and help various scientific disciplines synthesize their comparative studies and phylogenetic information. The ggtree graph object can be rendered as a static image, and the visualization directives that were previously saved in the object can be reused to display a different tree object in a manner akin to Microsoft Word Format Painter. Shuangbin Xu, Lin Li, Xiao Luo, Meijun Chen, Wenli Tang, Li Zhan, Zehan Dai, Tommy T. Lam, Yi Guan, Guangchuang Yu. 2022. Ggtree: A serialized data object for visualization of a phylogenetic tree and annotation data. iMeta. e56. https://doi.org/10.1002/imt2.56
iMeta: Integrated meta-omics to change the understanding of the biology and environment iMeta is an open-access Wiley partner journal launched by scientists of the Chinese Academy of Sciences. iMeta aims to promote metagenomics, microbiome, and bioinformatics research by publishing original research, methods, or protocols, and reviews. The goal is to publish high-quality papers (Top 10%, IF > 15) targeting a broad audience. Unique features include video submission, reproducible analysis, figure polishing, APC waiver, and promotion by social media with 500,000 followers. Three issues were released in March, June , and September 2022. iMetaScience office@imeta.science Society: http://www.imeta.science Publisher: https://wileyonlinelibrary.com/journal/imeta iMetaScience iMeta Submission: https://mc.manuscriptcentral.com/imeta
