Multidimensional Icons in Data Visualization Solutions
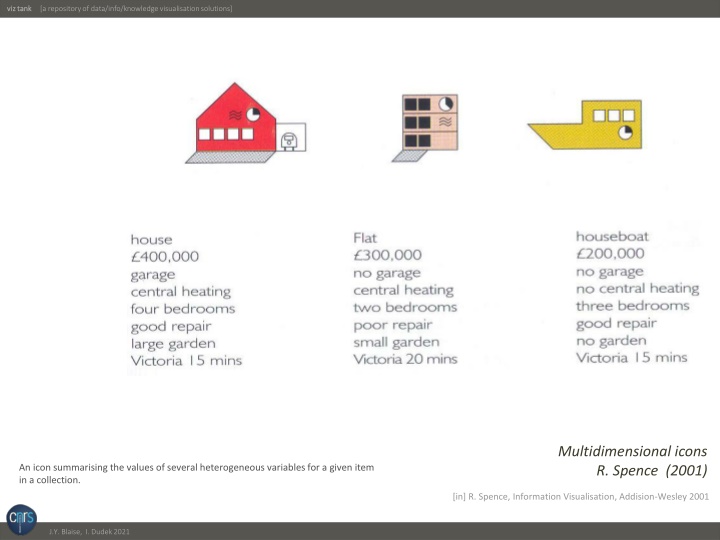
This collection showcases various types of visual icons used in data visualization to represent values of different variables, such as categorical, quantitative, and Boolean data. Each icon summarizes specific information for a given item in a collection, ranging from nominal and ordinal data to the state of objects. These icons serve as powerful tools for communicating complex data in a visually effective way, as outlined in R. Spence's work on information visualization.
Download Presentation

Please find below an Image/Link to download the presentation.
The content on the website is provided AS IS for your information and personal use only. It may not be sold, licensed, or shared on other websites without obtaining consent from the author.If you encounter any issues during the download, it is possible that the publisher has removed the file from their server.
You are allowed to download the files provided on this website for personal or commercial use, subject to the condition that they are used lawfully. All files are the property of their respective owners.
The content on the website is provided AS IS for your information and personal use only. It may not be sold, licensed, or shared on other websites without obtaining consent from the author.
E N D
Presentation Transcript
viz viz tank tank [a repository of data/info/knowledge visualisation solutions] Multidimensional icons R. Spence (2001) An icon summarising the values of several heterogeneous variables for a given item in a collection. [in] R. Spence, Information Visualisation, Addision-Wesley 2001 J.Y. Blaise, I. Dudek 2021
viz viz tank tank [a repository of data/info/knowledge visualisation solutions] shape of an icon type Multidimensional icons R. Spence (2001) Categorical data (nominal). < https://www.formpl.us/blog/categorical-data > [in] R. Spence, Information Visualisation, Addision-Wesley 2001 J.Y. Blaise, I. Dudek 2021
viz viz tank tank [a repository of data/info/knowledge visualisation solutions] colour rent Multidimensional icons R. Spence (2001) Quantitative data. [in] R. Spence, Information Visualisation, Addision-Wesley 2001 J.Y. Blaise, I. Dudek 2021
viz viz tank tank [a repository of data/info/knowledge visualisation solutions] pictogram garage Multidimensional icons R. Spence (2001) Boolean (~categorical). [in] R. Spence, Information Visualisation, Addision-Wesley 2001 J.Y. Blaise, I. Dudek 2021
viz viz tank tank [a repository of data/info/knowledge visualisation solutions] pictogram heating Multidimensional icons R. Spence (2001) Boolean (~categorical). [in] R. Spence, Information Visualisation, Addision-Wesley 2001 J.Y. Blaise, I. Dudek 2021
viz viz tank tank [a repository of data/info/knowledge visualisation solutions] number of windows number of bedrooms Multidimensional icons R. Spence (2001) Quantitative data. ( could be seen as ordinal data) [in] R. Spence, Information Visualisation, Addision-Wesley 2001 J.Y. Blaise, I. Dudek 2021
viz viz tank tank [a repository of data/info/knowledge visualisation solutions] colour of windows state of the object Multidimensional icons R. Spence (2001) Categorical data (ordinal). < https://www.formpl.us/blog/categorical-data > [in] R. Spence, Information Visualisation, Addision-Wesley 2001 J.Y. Blaise, I. Dudek 2021
viz viz tank tank [a repository of data/info/knowledge visualisation solutions] Presence / size of a grey trapezium (parallelogram) garden Multidimensional icons R. Spence (2001) Categorical data (ordinal). < https://www.formpl.us/blog/categorical-data > [in] R. Spence, Information Visualisation, Addision-Wesley 2001 J.Y. Blaise, I. Dudek 2021
viz viz tank tank [a repository of data/info/knowledge visualisation solutions] clock face proximity of a railway station Multidimensional icons R. Spence (2001) Quantitative (time-oriented) data. [in] R. Spence, Information Visualisation, Addision-Wesley 2001 J.Y. Blaise, I. Dudek 2021
