Do REST APIs Transform Marketing Dashboards for Better Data Flow_
Could REST APIs be the key to unlocking faster, more efficient data analysis in your marketing efforts? Explore the potential for rapid query generation and streamlined insights, transforming the way you leverage data for decision-making. Discover the potential of marketing dashboards and how they s
4 views • 6 slides

Quick Wins with Data_ How 5-Minute Dashboards Are Changing Business Intelligence
Unlock the power of Quick Wins with your data: Explore how 5-Minute Dashboards are revolutionizing Business Intelligence. Say goodbye to the frustrations of slow, complex analytics processes and welcome a new era where actionable insights are just minutes away with No-Code BI Tools. Transform decisi
1 views • 4 slides

Quick Wins with Data_ How 5-Minute Dashboards Are Changing Business Intelligence
Unlock the power of Quick Wins with your data: Explore how 5-Minute Dashboards are revolutionizing Business Intelligence.
4 views • 4 slides

Graphical representations of linear relationships
This material includes a series of checkpoint activities and additional tasks related to graphical representations of linear relationships for Year 8 students. Students will engage in tasks such as plotting points on coordinate grids, analyzing ant movements, exploring different rules for plotting p
1 views • 51 slides
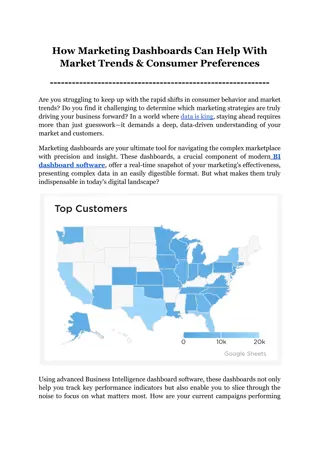
How Marketing Dashboards Can Help With Market Trends & Consumer Preferences
Dive into the capabilities of marketing dashboards and discover the secrets to staying ahead in a competitive market.
2 views • 5 slides

Don’t Confuse More Data with Better Insights — How to Streamline Your Marketing Dashboards
In today's data-driven world, more data doesn't always mean better insights. Learn how to streamline your marketing dashboards by focusing on core KPIs, ensuring data accuracy, and adopting a user-centric design. Discover practical tips for prioritizing metrics, implementing hierarchical layouts, an
3 views • 8 slides
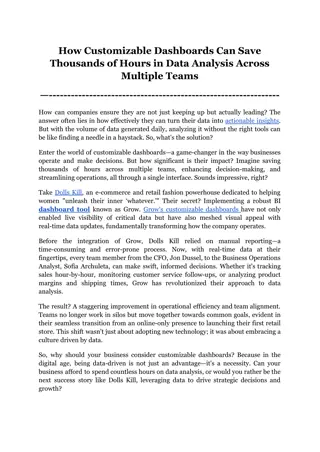
How Customizable Dashboards Can Save Thousands of Hours in Data Analysis Across Multiple Teams
Discover how customizable dashboards can dramatically streamline your data analysis process across multiple teams, saving thousands of hours and enhancing decision-making. Here you explores the transformative power of BI dashboard tools like Grow, which enable real-time data access and personalized
2 views • 5 slides
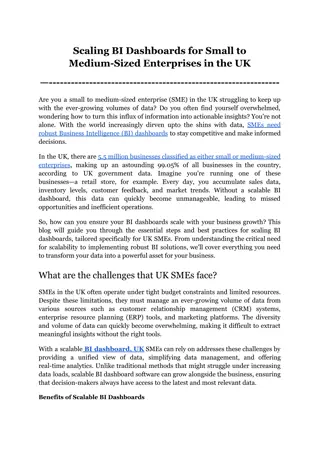
Scaling BI Dashboards for Small to Medium-Sized Enterprises in the UK
Scaling BI dashboards is crucial for small to medium-sized enterprises (SMEs) in the UK to effectively manage their growing data needs. This blog delves into the unique challenges and best practices for implementing scalable Business Intelligence (BI) solutions.
1 views • 6 slides
Why Customization Is the Key to Powerful Marketing Dashboards
Discover why customization is essential for creating powerful marketing dashboards. Learn how tailored dashboards can lower acquisition costs, improve revenues, and enhance marketing efficiency.\n\nThis explores the specific features and benefits of a customized marketing reporting dashboard, suppor
1 views • 8 slides
The Evolution of Graphical User Interfaces in Computing
Graphical User Interfaces (GUIs) have transformed computing into a more user-friendly and interactive experience, emphasizing the shift from technology-focused to human-centric living. This chapter delves into the various aspects of GUIs, including I/O alternatives, common GUI tasks, programming per
1 views • 32 slides
Network Perturbations in Computational Biology
Network-based interpretation and integration play a crucial role in understanding genetic perturbations in biological systems. Perturbations in networks can affect nodes or edges, leading to valuable insights into gene function and phenotypic outcomes. Various algorithms, such as graph diffusion and
0 views • 55 slides

The Joy of Sets: Graphical Alternatives to Euler and Venn Diagrams
Graphical representations of set membership can be effectively portrayed using alternatives to traditional Euler and Venn diagrams. Learn about upset plots, indicating set membership graphically, and the use of Venn or Euler diagrams as solutions. Explore the historical context and challenges with V
3 views • 43 slides

Roots of Equations in Engineering: Methods and Techniques
Roots of equations are values of x where f(x) = 0. This chapter explores various techniques to find roots, such as graphical methods, bisection method, false position method, fixed-point iteration, Newton-Raphson method, and secant method. Graphical techniques provide rough estimates, while numerica
0 views • 13 slides
USDA CXO Dashboards for Data-Driven Decision-Making
This document outlines the progress and plans for implementing CXO Dashboards within the USDA to enable data-driven decisions. It covers the purpose, accomplishments, current status, timeline, and risk assessment of the project. Key highlights include the development of executive and OCIO dashboards
0 views • 9 slides
Linear Programming - Graphical Method in Operations Research
This presentation explores the application of linear programming using the graphical method in the field of Operations Research. Dr. S. Sridevi, Assistant Professor, delves into the concepts and techniques involved in solving optimization problems through graphical representations. The slides cover
0 views • 24 slides
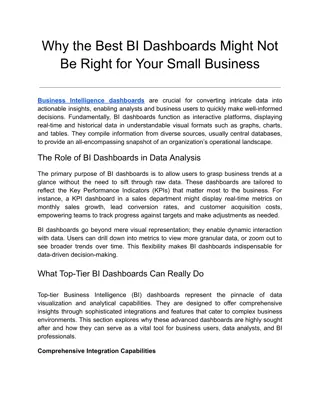
Why the Best BI Dashboards Might Not Be Right for Your Small Business
Explore why top-tier BI dashboards, though feature-rich, might not be the best fit for your small business. This article delves into the challenges and costs that come with sophisticated BI tools and highlights practical alternatives that align bette
1 views • 9 slides

Strategies for Effective Data Visualization
This talk by Nicholas J. Cox explores strategies to enhance data visualization for better interpretation and comparison. From spaghetti plots to front-and-back plots, various techniques are discussed to improve the clarity and effectiveness of graphical presentations. The presentation emphasizes the
1 views • 47 slides
Key Performance Indicators (KPIs) and Dashboards for Improved Performance
Key Performance Indicators (KPIs) play a vital role in assessing organizational performance across various areas. This content emphasizes the importance of measuring outcomes, monitoring uptime and downtime, and examples of KPIs in equipment management. It also provides insights on creating KPI dash
1 views • 11 slides

Using Cloud Computing to Scale Marketing Reporting Dashboards Across Enterprises
Discover how cloud computing is revolutionizing enterprise marketing by elevating the power and reach of the marketing reporting dashboards. This insightful blog explores the seamless integration of scalable cloud technologies to enhance data accessi
1 views • 7 slides
GPolygon Class in Graphical Structures
The GPolygon class in graphical structures is utilized to represent graphical objects bounded by line segments, such as polygons. This class allows for the creation of polygons with vertices connected by edges, utilizing methods like addVertex and addEdge to construct the shape. The reference point
0 views • 26 slides
Graphical Method for Velocity Analysis of Planar Mechanisms
Learn about the graphical method for velocity analysis of planar mechanisms through practice problems involving slider-crank mechanisms and link velocities. Understand how to calculate slider velocity, point velocity, and angular velocities using the given dimensions and rotational speeds. Visualize
0 views • 6 slides
Graphical User Interfaces in Java
Learn about designing graphical user interfaces in Java, including layout management, common components like radio buttons and menus, browsing Java documentation effectively, and utilizing inheritance for complex frames. Explore topics such as using layout managers to organize UI components, creatin
0 views • 74 slides
Java Swing for Building Graphical User Interfaces
Java Swing is a powerful framework for creating graphical user interface applications in Java. It provides a wide array of visual components such as JFrame, JComponent, and JPanel, enabling developers to build interactive and visually appealing applications easily. With Swing, developers can design
1 views • 25 slides

Enhancing Dashboard Creativity and Widget Usage for Effective Data Management
Explore the world of creative dashboards and worthwhile widgets in this session led by Shelly Rheinfrank. Learn how to change existing dashboards, add new ones, use and create widgets, and deploy navigation tips and tricks. Discover the art of customizing dashboards, adding new dashboards with a spe
0 views • 19 slides
Insights into Graphical Representation of Data in Business Mathematics
Graphical representation of data in Business Mathematics is a powerful tool that provides a bird's eye view of statistical information. It enables easy visualization of variations in variables, aiding in understanding time series and frequency distributions efficiently. While graphs offer quick esti
0 views • 18 slides

Introduction to R Programming: Statistical & Graphical Methods
R is a programming language developed in 1993 by Ross Ihaka and Robert Gentleman. It offers a wide range of statistical and graphical methods, making it a powerful tool for data analysis and visualization.
0 views • 35 slides
Introduction to Graphical User Interfaces (GUIs) in Python for Geographical Information Analysis
This content provides insights into creating Graphical User Interfaces (GUIs) in Python for Geographical Information Analysis. It covers the basics of GUI development using TkInter and event-based programming with a focus on user experience design and functionality. The lecture emphasizes the import
0 views • 45 slides
Probabilistic Graphical Models Part 2: Inference and Learning
This segment delves into various types of inferences in probabilistic graphical models, including marginal inference, posterior inference, and maximum a posteriori inference. It also covers methods like variable elimination, belief propagation, and junction tree for exact inference, along with appro
0 views • 33 slides

Developing a Graphical User Interface for High-Resolution X-ray Spectra Analysis
High-resolution X-ray spectra analysis can be challenging due to the complex nature of the information contained within. This project aims to simplify the process by developing a user-friendly graphical interface that enables users to visualize, analyze, and interpret X-ray spectra data effectively.
0 views • 19 slides

Graphical Models and Belief Propagation in Computer Vision
Identical local evidence can lead to different interpretations in computer vision, highlighting the importance of propagating information effectively. Probabilistic graphical models serve as a powerful tool for this purpose, enabling the propagation of local information within an image. This lecture
0 views • 50 slides

Graphical Technique for Adding Vectors - Example of Total Displacement Calculation
Example illustrating the graphical technique for adding vectors to determine the total displacement of a person walking three different paths on a flat field. The person walks specific distances in various directions, and the total displacement is calculated using head-to-tail method.
0 views • 11 slides
Probabilistic Graphical Models in Real-world Applications
Probabilistic Graphical Models (PGMs) offer a powerful framework for modeling real-world uncertainties and complexities using probability distributions. By incorporating graph theory and probability theory, PGMs allow flexible representation of large sets of random variables with intricate relations
1 views • 30 slides

Microsoft Excel 2016 Basics
Introduce yourself to the world of Microsoft Excel 2016, the most popular spreadsheet software in the world. Learn about its versatility in numerical calculations, creating charts, organizing lists, text manipulation, accessing data from various sources, creating graphical dashboards, automating tas
0 views • 14 slides

Introduction to Creating Graphical User Interfaces in MATLAB
Explore the world of creating Graphical User Interfaces (GUIs) in MATLAB with this informative guide. Learn how to design GUIs, program them to respond to user actions, and launch them effortlessly. Dive into essential topics such as GUI creation, component layout, and programming details, all witho
0 views • 40 slides

Introduction to Graphical User Interface (GUI) in MATLAB
A graphical user interface (GUI) allows users to interact with software using visual elements like menus, buttons, and icons, instead of text-based commands. In MATLAB, GUIs consist of two main files - an .m file for code and a .fig file for graphical elements. GUIs enable users to interact with MAT
0 views • 50 slides

Graphical Solutions of Autonomous Equations in Mathematics II
Explore the graphical solutions of autonomous equations in Mathematics II taught by lecturer Wisam Hayder at Diyala University's College of Engineering. Learn about phase lines, equilibrium values, construction of graphical solutions, and sketching solution curves using phase lines. Dive into exampl
0 views • 34 slides
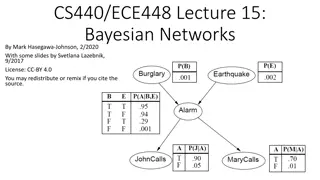
Bayesian Networks for Efficient Probabilistic Inference
Bayesian networks, also known as graphical models, provide a compact and efficient way to represent complex joint probability distributions involving hidden variables. By depicting conditional independence relationships between random variables in a graph, Bayesian networks facilitate Bayesian infer
0 views • 33 slides
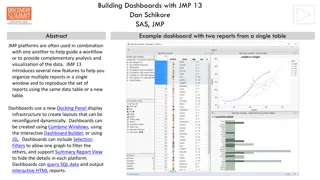
Building Dashboards with JMP 13: Organizing and Reproducing Reports Dynamically
JMP 13 introduces new features for creating interactive dashboards with multiple reports using Docking Panels for reconfigurable layouts. Dashboards can be customized using Combine Windows, Dashboard Builder, or JSL, allowing for dynamic organization and visualization of data. Learn how to maximize
1 views • 9 slides
Graphical Representations and Scale in Learning
Explore the similarities and differences of various graphical representations, apply scale in context, solve problems involving scale. Includes warm-up activities, launch on Mount Kosciuszko summit walk, and analyzing floor plans. Success criteria emphasize reading and problem-solving skills related
0 views • 9 slides

PearsonAccess Next Dashboards
Navigate through PearsonAccess Next Dashboards to access valuable information and insights. Learn about the roles and access rights, how to access the dashboards, view session and test statuses, and make the most out of the Dashboard Home Page.
0 views • 18 slides