Building Dashboards with JMP 13: Organizing and Reproducing Reports Dynamically
JMP 13 introduces new features for creating interactive dashboards with multiple reports using Docking Panels for reconfigurable layouts. Dashboards can be customized using Combine Windows, Dashboard Builder, or JSL, allowing for dynamic organization and visualization of data. Learn how to maximize and reposition reports within a dashboard and customize layouts for efficient data analysis.
Download Presentation

Please find below an Image/Link to download the presentation.
The content on the website is provided AS IS for your information and personal use only. It may not be sold, licensed, or shared on other websites without obtaining consent from the author.If you encounter any issues during the download, it is possible that the publisher has removed the file from their server.
You are allowed to download the files provided on this website for personal or commercial use, subject to the condition that they are used lawfully. All files are the property of their respective owners.
The content on the website is provided AS IS for your information and personal use only. It may not be sold, licensed, or shared on other websites without obtaining consent from the author.
E N D
Presentation Transcript
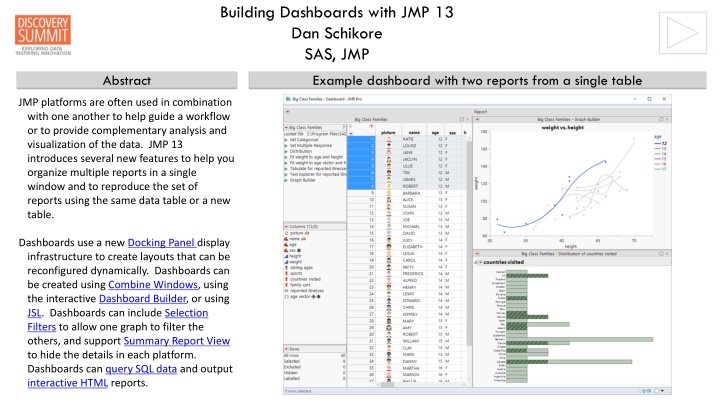
Building Dashboards with JMP 13 Dan Schikore SAS, JMP Abstract Example dashboard with two reports from a single table JMP platforms are often used in combination with one another to help guide a workflow or to provide complementary analysis and visualization of the data. JMP 13 introduces several new features to help you organize multiple reports in a single window and to reproduce the set of reports using the same data table or a new table. Dashboards use a new Docking Panel display infrastructure to create layouts that can be reconfigured dynamically. Dashboards can be created using Combine Windows, using the interactive Dashboard Builder, or using JSL. Dashboards can include Selection Filters to allow one graph to filter the others, and support Summary Report View to hide the details in each platform. Dashboards can query SQL data and output interactive HTML reports.
Building Dashboards with JMP 13 Dan Schikore SAS, JMP Docking Panels Dragging a report within a dashboard Docking Panels are a new feature that creates reconfigurable layouts using Tab Page Box, Tab Box, and Splitter Box. All reports and tables in a dashboard use Tab Page Box containers, which can be combined together using Splitter Box for horizontal/vertical layout, or Tab Box for a tabbed view. Using click-and-drag on the Tab Page Box title, the components of a dashboard can be repositioned within a window. An additional button in the title bar allows an individual report to be maximized to fill the entire window ( ) or returned to original size ( ).
Building Dashboards with JMP 13 Dan Schikore SAS, JMP Combine Windows Options Customizing the Result The fastest way to interactively create a dashboard is by combining multiple existing reports and data tables. Options can be selected during combining: Dashboards created with Combine Windows can be edited further by choosing the Edit Dashboard option from the red-triangle menu. 1. The dashboard name is used when saving to a data table or Add-In 2. Select Summary Report View to hide the details in each report 3. Choose up to one report from each data table to act as a filter on other reports 1. Select Window > Combine Windows 2. Select the Combine check box for each window that you want to include in the dashboard. 3. Click OK Other options in the menu allow you to toggle the Summary Report View for all reports, rerun the dashboard, and save the script to a Data Table or Add-In
Building Dashboards with JMP 13 Dan Schikore SAS, JMP Dashboard Builder Populating a template Editing and saving the result Dashboard Builder is a drag-and-drop environment for building layouts of reports and data tables, with optional Local Data Filters or Selection Filters. Select File > New Dashboard from the main menu to see a list of template options and sample dashboards: After choosing a template, you will see a list of reports and display elements that can be added to the report. You can add elements to the display in three ways: Additional features are available through direct interaction or menus: 1. Double-click on a Tab Page title to edit 1. Double-click from the source list 2. Drag from the source list 3. Select in the source list and then single- click on a placeholder in the workspace 2. Right-click on a report to add or remove a Selection Filter 3. Toggle Preview Mode from the red- triangle menu to see what the final dashboard will look like before saving 4. Save the dashboard to the data table or an Add-In from the red-triangle menu 5. Click and hover over a tab page title or text box to change the font or text size
Building Dashboards with JMP 13 Dan Schikore SAS, JMP Selection Filters Adding a filter Data Filters are used to analyze and visualize subsets of data in JMP. The Selection Filter feature enables you to use any existing JMP platform as the interface to the filter. Rows selected in the filtering platform are included in the linked platforms, and unselected rows are excluded. To add a selection filter within Dashboard Builder, right-click on a report, or on a container that includes multiple reports, and choose Use As Selection Filter. When multiple reports are selected at the same time, selection within the filter reports is linked, and the aggregate selection is used to filter the reports. The net result is similar to an OR operation on the selections performed in each report. As with independent reports, use shift-click to extend the selection without canceling the selection in another report. Selection filters can be added during a Combine Windows operation, and you can also add and remove filter behaviors within Dashboard Builder. A hierarchical selection filter allows each filter level to successively narrow the set of included rows provided from the higher level filter. The net result in this case is equivalent to an AND operation on the selections. Hierarchical selection filters If you have multiple reports within a selection filter, right-clicking on one of the reports will give you an option to turn the filter into a hierarchical filter.
Building Dashboards with JMP 13 Dan Schikore SAS, JMP Summary Report View Customizing Platform Views A main goal in dashboard design is to choose elements that are easily and quickly interpreted. JMP platforms often present statistical results along with supporting graphs. The Summary Report View allows you to easily toggle between the Full view of the Report and the Summary view. Using Summary Report View is one way to reduce the overload of information when combining multiple reports together. Before you start building your dashboard, consider other ways to eliminate content that does not contribute to the dashboard. Turning off unnecessary platform options and closing outlines to hide secondary details will help to focus attention. The default behavior of Summary View is to show the graphs and make them stretchable, but some platforms override this behavior to show important details as well. When the Report View is set from the main Report red-triangle menu, the change applies to all platforms in the window. The property can also be set from the red- triangle menu for an individual platform in a dashboard.
Building Dashboards with JMP 13 Dan Schikore SAS, JMP Query Builder Using a static query The SQL Query Builder was introduced in JMP 12 and allows for interactive creation of database queries. JMP 13 introduces the JMP Query Builder to perform similar operations on existing JMP tables. If the table that was produced from a query is also saved to a file, you will have the option to rerun the query or use the saved file. When a table is created as the result of a query, the default behavior will be to rerun the Source script that is stored in the table each time the dashboard is run.
Building Dashboards with JMP 13 Dan Schikore SAS, JMP Interactive HTML Output Beginning with JMP 12 there is an option to save a report as Interactive HTML, which for many platforms allows interactive selection and brushing to be done in the browser, without using JMP. JMP: JMP 13 has many improvements for Interactive HTML output. Support for most of the Graph Builder elements is particularly useful for Dashboard displays, and updates for Tab Page Box and Splitter Box help to faithfully reproduce dashboard layouts. To output Interactive HTML from any individual platform report or dashboard report, choose the Interactive HTML format from the File > Save As dialog. HTML:
Building Dashboards with JMP 13 Dan Schikore SAS, JMP JSL Tab Page Box Summary View New features that were added to display boxes to support dashboard layouts are also available for JSL developers to use in custom applications. Tab Page Box has always existed as an interface between a Tab Box container and the content of the individual pages. With JMP 13, Tab Page Box can also be used as a stand-alone container. Tab Pages that are children of a Tab Box will share the title space as before: Summary Report View can be toggled on during combine windows, from the red- triangle menu of a report in a dashboard, or from the red-triangle for the dashboard itself. When Summary Report View is active, only the main results will be shown, and graphs will be made stretchable. Docking Panels Docking Panels are a combination of docking support for Tab Box and Splitter Box and moveable support for Tab Page Box: To change the report view from JSL: platform << Report View( Full | Summary ) Tab Box / Splitter Box: box << Dockable(1); Tab Pages that are stand-alone will draw their own title: A default set of rules determine which graphs or other boxes will be visible in summary view. To change the behavior of any box: Tab Page Box: box << Moveable(1); Tab Pages can also be moveable in a non- docking layout. In this case the Tab Page can be repositioned within a parent Tab Box, but cannot be dragged elsewhere. To construct a Tab Page Box: box << Set Summary Behavior( Default | Visible | Collapse ) page = Tab Page Box( title ,[options],content )
