PearsonAccess Next Dashboards

 undefined


PearsonAccess Next
Dashboards
Topics
Dashboard Introduction
Dashboard Roles
Accessing the Dashboards
Dashboard Home page
Dashboard User Settings
Dashboard Introduction
•
PAN Dashboards provide a visual display of information
available elsewhere in PearsonAccess Next (PAN).
•
A Dashboard icon will be available on the top menu bar on all
pages in PAN for users with the permissions described on the
next slide.
Dashboard Roles
The following PAN user roles have dashboard access:
•
District Test Coordinator
•
School Test Coordinator
•
Technology Coordinator
•
Select the correct
administration in the
upper right-hand corner.
•
If you have access to multiple
organizations in PAN, select the correct
organization in the upper right-hand
corner.
Accessing the
Dashboards
To access the PAN Dashboard home page, select the
Dashboard icon, and in the drop-down menu, select
Dashboard
.
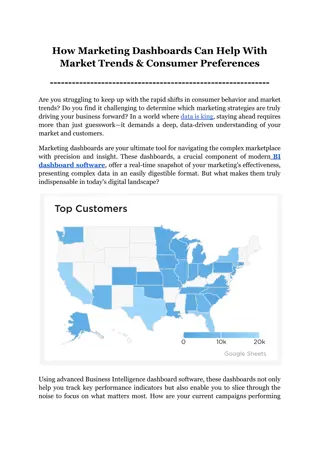
Dashboard Home Page
Here is a
view of the
Dashboard
home
screen.
Dashboard Home
Dashboards can be viewed by subject or grade on the Dashboard home
page as follows:
•
Session Status graph:
Shows the number of PAN Sessions that
are in each status: Not Prepared, Preparing, Errors – Not
Prepared, Ready, In Progress, and Stopped.
•
Student Test Status graph:
Shows the number of student tests
that are in each status: Ready, Resumed/Resumed Upload,
Active, Exited, and Complete/Marked Complete.
•
Test Status – Online graph:
Shows the number of computer-
based tests that are in each status: Assigned, in Progress, and
Complete.
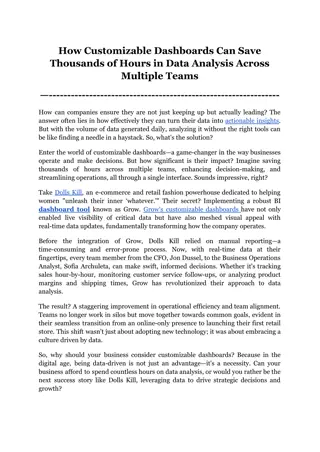
Dashboard Home Page –
Session Status Dashboards
Session Status by Subject or Grade
Dashboard Home Page –
Student Test Status
Dashboard
Student Test Status by Subject or Grade
Dashboard Home Page
– Test Status - Online
Test Status - Online by Subject or Grade
Dashboard Hyperlinks
Dashboard User
Settings
•
Users can adjust what they see on their Dashboard home page
by changing the settings on the Dashboard User Settings page.
•
On the Dashboard User Settings page, users can:
o
Remove dashboards from their home page
o
Change the order in which the dashboards appear on their home page
o
Change the type of graph for each dashboard
o
Change the number of columns in which the dashboards appear
•
To access the Dashboard
User Settings, select the
Dashboard icon, and from
the drop-down menu, select
Dashboard User Settings.
Dashboard User
Settings—Change Order
Change the order in
which dashboards
appear by holding
down the crossed
arrows of a particular
dashboard and
moving the dashboard
around the page.
Change the type of
graph that is shown
by selecting a graph
from the drop-down
menu.
Remove a dashboard
from your home page
by selecting
“Remove.”
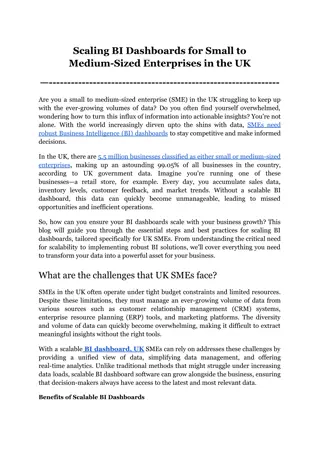
Dashboard User
Settings—Graph Types
Users can select from three graph
types: bar, stacked bar, and
speedometer. Note that for the
following dashboards, not all graph
types are available: Session Status by
Grade, Student Test Status by Grade,
and Test Status – Online by Grade.
Bar graph with filter
Speedometer
Stacked bar graph
Dashboard User
Settings—Columns
Change the number of
columns that appear on
your Dashboard home page
by selecting from the
Number of Columns drop-
down menu.
Dashboard User
Settings - Columns
Example of the home page with one column:
Example of the home page with three columns:
Saving Dashboard User
Settings
After making the desired changes to your dashboards, select Save.
Thank you.
Thank you.
These training slides give an overview of the Dashboards feature in PearsonAccess Next.
Additional information is included in the Notes section of most slides.
Navigate through PearsonAccess Next Dashboards to access valuable information and insights. Learn about the roles and access rights, how to access the dashboards, view session and test statuses, and make the most out of the Dashboard Home Page.

Uploaded on Dec 14, 2024 | 1 Views
Download Presentation

Please find below an Image/Link to download the presentation.
The content on the website is provided AS IS for your information and personal use only. It may not be sold, licensed, or shared on other websites without obtaining consent from the author. Download presentation by click this link. If you encounter any issues during the download, it is possible that the publisher has removed the file from their server.
E N D
Presentation Transcript
PearsonAccess Next Dashboards
Topics Dashboard Introduction Dashboard Roles Accessing the Dashboards Dashboard Home page Dashboard User Settings
Dashboard Introduction PAN Dashboards provide a visual display of information available elsewhere in PearsonAccess Next (PAN). A Dashboard icon will be available on the top menu bar on all pages in PAN for users with the permissions described on the next slide.
Dashboard Roles The following PAN user roles have dashboard access: District Test Coordinator School Test Coordinator Technology Coordinator If you have access to multiple organizations in PAN, select the correct organization in the upper right-hand corner. Select the correct administration in the upper right-hand corner.
Accessing the Dashboards To access the PAN Dashboard home page, select the Dashboard icon, and in the drop-down menu, select Dashboard.
Dashboard Home Page Here is a view of the Dashboard home screen.
Dashboard Home Dashboards can be viewed by subject or grade on the Dashboard home page as follows: Session Status graph: Shows the number of PAN Sessions that are in each status: Not Prepared, Preparing, Errors Not Prepared, Ready, In Progress, and Stopped. Student Test Status graph: Shows the number of student tests that are in each status: Ready, Resumed/Resumed Upload, Active, Exited, and Complete/Marked Complete. Test Status Online graph: Shows the number of computer- based tests that are in each status: Assigned, in Progress, and Complete.
Dashboard Home Page Session Status Dashboards Session Status by Subject or Grade
Dashboard Home Page Student Test Status Dashboard Student Test Status by Subject or Grade
Dashboard Home Page Test Status - Online Test Status - Online by Subject or Grade
Dashboard User Settings Users can adjust what they see on their Dashboard home page by changing the settings on the Dashboard User Settings page. On the Dashboard User Settings page, users can: o Remove dashboards from their home page o Change the order in which the dashboards appear on their home page o Change the type of graph for each dashboard o Change the number of columns in which the dashboards appear To access the Dashboard User Settings, select the Dashboard icon, and from the drop-down menu, select Dashboard User Settings.
Dashboard User Settings Change Order Change the order in which dashboards appear by holding down the crossed arrows of a particular dashboard and moving the dashboard around the page. Remove a dashboard from your home page by selecting Remove. Change the type of graph that is shown by selecting a graph from the drop-down menu.
Dashboard User Settings Graph Types Bar graph with filter Users can select from three graph types: bar, stacked bar, and speedometer. Note that for the following dashboards, not all graph types are available: Session Status by Grade, Student Test Status by Grade, and Test Status Online by Grade. Speedometer Stacked bar graph
Dashboard User Settings Columns Change the number of columns that appear on your Dashboard home page by selecting from the Number of Columns drop- down menu.
Dashboard User Settings - Columns Example of the home page with one column: Example of the home page with three columns:
Saving Dashboard User Settings After making the desired changes to your dashboards, select Save.