
The Joy of Sets: Graphical Alternatives to Euler and Venn Diagrams
Graphical representations of set membership can be effectively portrayed using alternatives to traditional Euler and Venn diagrams. Learn about upset plots, indicating set membership graphically, and the use of Venn or Euler diagrams as solutions. Explore the historical context and challenges with V
3 views • 43 slides

Business Mathematics: Various Bar Diagrams and Charts Explained
This comprehensive guide covers the concepts of sub-divided bar diagrams, duo-directional bar diagrams, sliding bar diagrams, and pie charts in Business Mathematics. It includes definitions, examples, and solutions to help understand how to represent data effectively using these graphical tools. Ms.
0 views • 15 slides

Network Diagrams for Resource Management Techniques
Examples of network diagrams and arrow diagrams for different relationships in resource management techniques are provided. The diagrams illustrate activity sequences, dependencies, and solutions for various scenarios. These visual representations aid in planning, scheduling, and managing resources
3 views • 6 slides
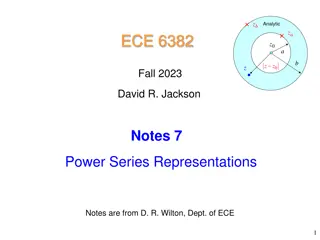
Geometric Series: Power Series Representations & Convergence
Geometric series analysis discusses the summation, convergence, and divergent properties within and outside the unit circle. The series' representation, convergence conditions, and extensions are explored through power series expansions and geometric series summations, providing a comprehensive unde
0 views • 50 slides
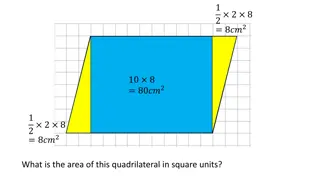
Geometric Problems and Solutions
Explore various geometric problems related to quadrilaterals, rectangles, parallelograms, and tangrams. Learn about finding areas, transforming shapes, and solving puzzles. Discover the principles behind turning a rectangle into a parallelogram and identifying areas of different geometric figures.
0 views • 7 slides
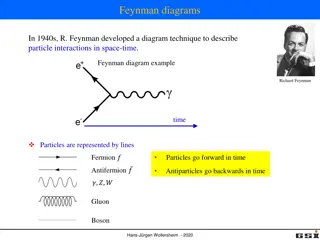
Feynman Diagrams in Particle Physics
Feynman diagrams, developed by Richard Feynman in the 1940s, are a graphical technique to represent particle interactions in space-time. These diagrams use lines to depict particles, with fermions moving forward in time and antifermions moving backward. Vertices in the diagrams represent points wher
1 views • 19 slides

Water Management Plans for Healthcare Facilities - Process Flow Diagrams
Editable water system process flow diagrams for healthcare facilities based on recommendations from CDC and ASHRAE. Includes instructions for customization and samples for various water flow scenarios. Ensures facilities can create customized diagrams tailored to their specific needs for effective w
2 views • 7 slides
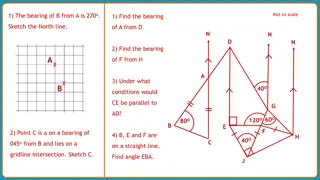
Solving Bearings and Geometric Problems
This content discusses solving problems involving bearings, geometric shapes, and properties of triangles and lines. It covers determining bearings between points, finding angles in isosceles triangles, and understanding parallel lines and angles. The content also includes information on angles in q
0 views • 6 slides

Geometric Line Sweep Algorithms
Geometric Line Sweep is a powerful technique where an imaginary line sweeps over points, performing geometric operations at each point. This method can find minimum distances between points, overlapping rectangles, and more. By sorting points and efficiently processing them, it can enhance performan
0 views • 10 slides

Geometric Routing Concepts and Byzantine Fault Tolerance
Geometric Routing enables routing without overhead, where each node knows its global coordinates and forwards messages based on proximity to the destination. Byzantine Faults pose challenges with arbitrary node behavior, but a Byzantine-Robust Geometric Routing algorithm addresses this in a 3-connec
3 views • 33 slides

Overview of Loop Diagrams in Process Control Systems
Loop diagrams are essential documents in process control systems, providing schematic representations of hydraulic, electric, magnetic, or pneumatic circuits. They detail instrumentation arrangements, signal connections, power connections, and termination information. Guidelines and standards for cr
1 views • 5 slides

Various Quality Improvement Diagrams for Root Cause Analysis
Explore a series of quality improvement diagrams such as fishbone diagrams, cause-and-effect flow charts, error reduction improvement diagrams, and root cause analysis steps. These visual tools offer insights into identifying and addressing root causes of issues in different processes or systems.
0 views • 12 slides

Key Driver Diagrams in Continuous Quality Improvement
Key Driver Diagrams are essential tools in Continuous Quality Improvement (CQI) to help organizations achieve their goals by identifying key drivers and their relationships. These diagrams aid in understanding complex systems, setting SMART aims, and implementing effective change strategies. Through
1 views • 24 slides
Geometric Probabilities: From Fractions to Integrals
Delve into the realm of geometric probabilities with insights on how to transition from fractions to definite integrals, utilizing technology for enhanced learning experiences. Understand the significance of probability calculations in quantifying likelihood, incorporating geometric representations
0 views • 26 slides
Geometric and Poisson Probability Distributions
Explore the geometric and Poisson probability distributions, including criteria for geometric random variables, formulas, and practical examples. Learn how to calculate probabilities using the geometric distribution and apply it in scenarios like Russian Roulette and blood donor collection. Dive int
0 views • 13 slides
Activity Diagrams and State Chart Diagrams
Activity diagrams describe the workflow behavior of a system by showing the sequence of activities performed, including conditional and parallel activities. Elements such as Initial Activity, Symbol Activity, Decisions, Signals, Concurrent Activities, and Final Activity are depicted in these diagram
0 views • 10 slides
Overview of Proposed Changes in Producer Price Index Formulas
The U.S. Bureau of Labor Statistics is considering transitioning from a modified Laspeyres formula to a geometric Young formula for elementary indexes in the Producer Price Index (PPI). This proposed change aims to enhance the accuracy and economic relevance of price measurements by utilizing a geom
0 views • 25 slides

UML Package Diagrams and Components in Software Design
UML package diagrams are essential in organizing model elements such as use cases and classes into groups for a better structure in system modeling. They help in providing a high-level overview of requirements and architecture, logically modularizing complex diagrams, and indicating dependencies bet
1 views • 38 slides

Testing in Software Engineering
In the previous session, we discussed various aspects of software engineering, including modeling with UML diagrams, such as activity diagrams, use case diagrams, sequence diagrams, state diagrams, and class diagrams, as well as architecture patterns. Testing was emphasized as a key aspect, highligh
1 views • 35 slides
Geometric Construction and Geometrical Figures Lecture Images
Explore a series of informative images illustrating geometric construction, types of angles, triangles, and various geometric figures like squares, rectangles, rhombuses, parallelograms, and circles. Enhance your understanding of key geometric concepts with these detailed visuals.
1 views • 14 slides

UML Activity Diagrams in Software Design
UML Activity Diagrams provide a modern way to visualize business processes, workflows, data flows, and complex algorithms in software systems. They use symbols to represent different parties involved, actions performed, transitions, and control flows. These diagrams help in modeling data flows, obje
0 views • 14 slides
QuickDraw: Revolutionizing Diagram Drawing with Precision and Ease
Diagrams play a crucial role in various fields like Mathematics and Physics but creating them can be challenging and time-consuming. QuickDraw offers a solution by enabling natural sketching of diagrams followed by constraint-based precise beautification, making the process efficient and accurate. W
0 views • 23 slides
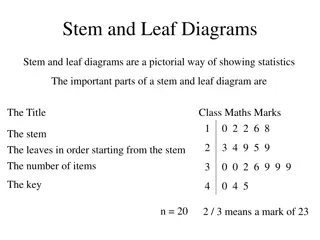
Stem and Leaf Diagrams for Statistical Analysis
Stem and leaf diagrams provide a visual way to represent statistical data effectively. This article showcases examples of stem and leaf diagrams for various datasets, including math marks, pulse rates, pocket money, speeds of cars, distances in meters, and comparison between two classes. The diagram
0 views • 6 slides
Sequence Diagrams in Software Development
Sequence diagrams depict the sequence of actions in a system, capturing the invocation of methods in objects. They are a valuable tool for representing dynamic system behavior. Message arrows in sequence diagrams indicate communications between objects, illustrating synchronous and asynchronous mess
0 views • 21 slides
Venn Diagrams and Categorical Syllogisms
Venn diagrams, introduced by John Venn, visually represent relationships between different classes. Shading in diagrams signifies empty sets or no overlap between classes. Different types of categorical statements such as universal and particular are illustrated using examples. Explore how Venn diag
0 views • 30 slides

Software Process Modeling State Diagrams Lab Exercises
Dive into the world of state diagrams and state machine diagrams in software process modeling. Explore hands-on exercises such as creating state diagrams for controlling air conditioners and garage doors. Understand the importance of capturing object states in OOP and learn how to represent transiti
0 views • 7 slides
Geometric Construction in Engineering Drawing: Lecture Highlights
Geometric construction involves creating primitive geometric forms like points, lines, and planes to define objects in space. The lecture covers the basics of 2D geometric primitives, such as points, lines, circles, and arcs. It explains the significance of points and lines in technical drawings and
0 views • 18 slides
Decision Diagrams for Sequencing and Scheduling Techniques
This research explores the application of decision diagrams for optimization problems, particularly in sequencing and scheduling. The study delves into novel techniques for discrete optimization problems, providing insights into decision diagram definitions and their practical applications. The diag
1 views • 52 slides

Drawing Network Diagrams for Activity Relationships and Resource Management Techniques
In this content, various network diagrams and arrow diagrams are illustrated to represent relationships between activities, showcasing Resource Management Techniques. The diagrams depict the flow and dependencies of tasks, aiding in visualizing project structures. These diagrams help in understandin
0 views • 6 slides

Drawing Network Diagrams for Activity Relationships
The process of drawing network diagrams or arrow diagrams to represent relationships between activities. The diagrams illustrate sequencing and dependencies to aid in project management, scheduling, and resource allocation. Various examples and solutions are provided for better understanding and app
0 views • 7 slides
Geometric series
A geometric series involves the sum of successive terms in a geometric sequence. By understanding the formula and principles behind geometric series, you can efficiently calculate the sum of the first n terms. Explore examples and formulas to find solutions for different series, whether the common r
0 views • 15 slides

Hierarchy Structures and Diagrams: Exploring 24.02.2025
In this content, you will find a series of images depicting hierarchy structures, diagrams, and tests related to the date 24.02.2025. The images showcase various levels, diagrams, and tests in an organized manner. Each image provides a visual representation of different aspects, including diagrams w
0 views • 13 slides

Geometric Sequences: Definitions, Examples, and Formulas
Delve into the world of geometric sequences with a comprehensive overview of definitions, key concepts, examples, and essential formulas. Explore the common ratio, differences between arithmetic and geometric sequences, find common ratios in given examples, and solve sample problems to solidify your
0 views • 24 slides
Predicate Decision Diagrams for Explainable Policy Representation
This study introduces Predicate Decision Diagrams for Explainable Policy Representation, showcasing a structured approach for efficient policy modeling in complex systems. The diagrams illustrate a methodical way to represent policies through decision trees, aiding in transparent decision-making pro
0 views • 41 slides

Computational Geometry: Voronoi Diagrams and Applications
Voronoi diagrams, also known as Dirichlet tessellations, play a crucial role in computational geometry. These diagrams partition a space into cells based on a set of points, allowing for applications like nearest neighbor queries and facility location optimizations. Bisectors, Voronoi cells, and dia
0 views • 19 slides

Valuable Chain Diagrams for MSA Teams
This content highlights three valuable chain diagrams - RICE, SANITATION, and HYGIENE, offering insights into different actors and processes within the value chains. The diagrams present a visual representation of the various stakeholders involved in each chain, facilitating a comprehensive understa
0 views • 4 slides
Applications of Poisson, Geometric, and Modified Geometric Distributions in ECE 313 Lecture
Explore the applications of important discrete distributions such as Poisson, Geometric, and Modified Geometric in electrical and computer engineering, as discussed in ECE 313 Probability with Engineering Applications Lecture 10 by Ravi K. Iyer. Topics include random variables, examples of geometric
0 views • 35 slides
Visualizing Student Migration Data with Sankey Diagrams
Learn the basics of Sankey diagrams and how they are used in Institutional Research. Gain insights into creating Sankey diagrams using Google Charts and Excel data. Explore examples and applications of Sankey diagrams for tracking student transitions and major changes in educational institutions.
0 views • 30 slides
Model Based Systems Engineering: Diagrams and Processes Explained
Explore the world of Model Based Systems Engineering through various diagrams like Block Definition Diagrams and Activity Diagrams. Understand the processes and concepts with visual representations. Dive into SysML and its taxonomy for a comprehensive view.
0 views • 40 slides

Geometry Chapter 6: Ratios, Proportions, and Geometric Mean Explained
Explore the concept of ratios, proportions, and geometric mean in Geometry Chapter 6. Learn how to simplify ratios, find angles in triangles, solve proportions, calculate the value of x, and understand properties of proportions. Discover the practical applications of these geometric concepts through
0 views • 39 slides