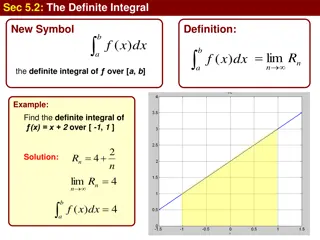
Geometric Probabilities: From Fractions to Integrals
Delve into the realm of geometric probabilities with insights on how to transition from fractions to definite integrals, utilizing technology for enhanced learning experiences. Understand the significance of probability calculations in quantifying likelihood, incorporating geometric representations to aid comprehension. Discover the immersive approach blending probability, geometry, and measurement while leveraging technology, shaping the instructional context for teacher candidates. Uncover the influence of STEM education and historical contributions to geometric probability, culminating in a formal definition to grasp the essence of this mathematical concept.

Download Presentation

Please find below an Image/Link to download the presentation.
The content on the website is provided AS IS for your information and personal use only. It may not be sold, licensed, or shared on other websites without obtaining consent from the author.If you encounter any issues during the download, it is possible that the publisher has removed the file from their server.
You are allowed to download the files provided on this website for personal or commercial use, subject to the condition that they are used lawfully. All files are the property of their respective owners.
The content on the website is provided AS IS for your information and personal use only. It may not be sold, licensed, or shared on other websites without obtaining consent from the author.
E N D
Presentation Transcript
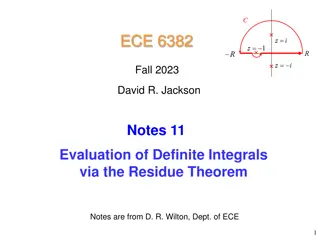
GEOMETRIC PROBABILITIES: FROM FRACTIONS TO DEFINITE INTEGRALS USING TECHNOLOGY Sergei Abramovich State University of New York, Potsdam, USA
National Council of Teachers of Mathematics (PSSM: 2000) Probability is a curriculum strand that spans across grades 1 12. Calculation of probability is a quantification of the likelihood of an event. Measurement includes assigning a number to a characteristic of a situation. Geometric representations can help students make sense of area and fractions.
Combining Probability, Geometry, and Measurement while using Technology Geometric approach to the measurement of likelihood involved construction of regions in the sample space and finding measures of those regions. The approach lends itself to the use of technology: it influences the mathematics that is taught (Technology Principle, p.24)
Instructional context Elementary teacher candidates (Content and Methods courses) Secondary mathematics teacher candidates (The capstone course)
STEM education Engineering might not be a discipline that people expect to find in elementary or even secondary school but it is a powerful way of teaching, learning, and extending educational methods. Rogers & Portsmore, Bringing Engineering to Elementary School, Journal of STEM Education, 2004, 5(3/4), p. 25.
Technology used --Spreadsheets --The Graphing Calculator 3.5 (Pacific Tech), alternatively NuCalc http://en.wikipedia.org/wiki/NuCalc --The Geometer s Sketchpad (Key Curriculum Press) --Maple
History Buffon a French naturalist, mathematician, and cosmologist of the 18thcentury. Worked on the development of fair games by introducing calculus into probability. The Needle Problem (the first geometric probability problem): determining the probability of a needle landing on one of a set of parallel lines when dropped at random on a plane.
Formal definition of geometric probability Consider a trial consisting in a random choice of a point over the region D. The outcomes of this trial are uniformly distributed over D. Let E be an event that a point chosen randomly from D belongs to its part d. Then P(E)=measure(d)/measure(D)
The didactic of geometrization To find a lucid geometric representation for your nongeometrical problem could be an important step toward the solution. G. Polya, How to Solve It, 1945, p. 108
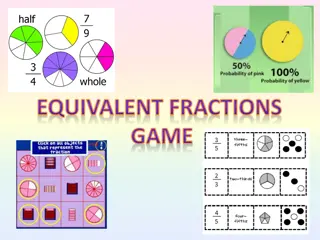
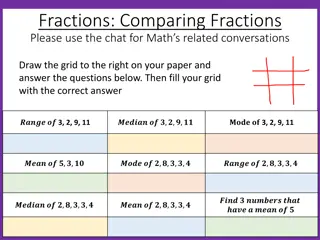
Early elementary curriculum There are three chances out of four to pick up an even number from the set {1, 2, 4, 6}. How can one measure the likelihood (or chances) for such an event to realize? Recourse to geometry and Application of fractions What fraction of the square is filled with even numbers? (A dart game).
Spreadsheet as a geometric medium (elementary classroom) A machine changed a 25-cent coin (a quarter) into dimes, nickels, and pennies. Assuming that there is equally likely to get any combination of the coins, find the probability that there are no pennies in the change. What fraction of the (staircase-like) chart is shaded? P(E)=3/12=1/4
Comparing probabilities through geometrization Billy wants to eat red M&Ms only. There are two bags of M&Ms available, plain and peanut. If there are 3 red plain out of 5 total and 4 red peanut out of 7 total, for which bag does Billy have higher probability to get a red M&M? X s --- 3/5; O s ---4/7 21 X s; 20 O s. Higher probability for the bag with plain candies. This is not the end of the story!
Fractions may be challenging not only for children! Billy and Mary want to eat red M&Ms only. If there are 3 red plain out of 5 total and 4 red peanut out of 7 total, how many red M&Ms of each kind does Billy have to eat in order for Mary to have higher probability to get a red peanut M&M? How can we replicate such a situation?
Probabilistic approach to exploring systems depending on parameters systems may have unexpected effects that can not be predicted from the behavior of individual subsystems. Committee on K-12 Engineering Education (2009).
Behavior of linear functions with parameters A point M (a, b) is chosen at random over the rectangle with the vertices (-2, 0), (-2, 5), (4, 5), (4, 0). What is the probability that the function f(x) = ax + b at the points x = 2, x = -1, and x = -0.5 assumes values such that f(2) > -2, f(-1) > 1, f(-0.5) < 3? Triangular region of parameters responsible for the behavior of f(x)
Multiple ways of finding the area Traditional integration (pencil-and-paper) Integration using math software (e.g., Maple) The use of The Geometer s Sketchpad Pick s formula (Area = 0.5B + I 1: B = 9, I = 4, A = 7.5, P = 7.5/30 = 1/4)
Using a spreadsheet Geometric probability vs. experimental probability
Picks formula extended: Constructing points using two-variable inequalities
Construction technique made possible by the Graphing Calculator 3.5 The point (a0, b0) can be defined as the set where is the thickness of the point. In the plane of parameters (a, b) this set can be defined through the inequality
Geometric probabilities defined by curvilinear regions in the plane of parameters Parameters a and b are chosen at random over a large square with side 2R centered at the origin. What is the probability that the systems of simultaneous equations and both have two real solutions?
The case R < 4 (what fraction of the square is dark?) P = R/24 + 1/4 5/12 as R 4 Technology used: The Graphing Calculator 3.5, Maple
The case R > 4 (what fraction of the square is dark?) P = f(R) 5/12 < f(R) < 1
The case R = 4 (what fraction of the square is dark?) P = 5/12
Experimental Probability (R = 2) = 0.329. Geometric Probability (R = 2) = 0.333 .
Experimental Probability (R = 30) = 0.745. Geometric Probability (R = 30) = 0.758
Conclusion Geometric approach to probability: Gives new meaning to traditional concepts; Provides new context for technology use; Connects theory and experiment; Offers new avenues for problem solving, Enhances the E component of STEM education.


")
")
")
 = 0.329.")
 = 0.745.")