Valuable Chain Diagrams for MSA Teams
This content highlights three valuable chain diagrams - RICE, SANITATION, and HYGIENE, offering insights into different actors and processes within the value chains. The diagrams present a visual representation of the various stakeholders involved in each chain, facilitating a comprehensive understanding of the value creation process. MSA teams can utilize these diagrams as tools for analysis and customization to optimize their operations. The detailed breakdown of actors and market segments provides valuable information for strategic decision-making in the respective sectors.

Download Presentation

Please find below an Image/Link to download the presentation.
The content on the website is provided AS IS for your information and personal use only. It may not be sold, licensed, or shared on other websites without obtaining consent from the author. If you encounter any issues during the download, it is possible that the publisher has removed the file from their server.
You are allowed to download the files provided on this website for personal or commercial use, subject to the condition that they are used lawfully. All files are the property of their respective owners.
The content on the website is provided AS IS for your information and personal use only. It may not be sold, licensed, or shared on other websites without obtaining consent from the author.
E N D
Presentation Transcript
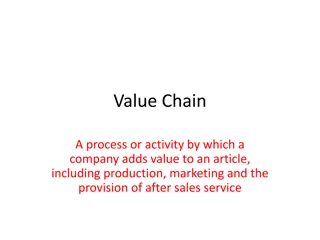
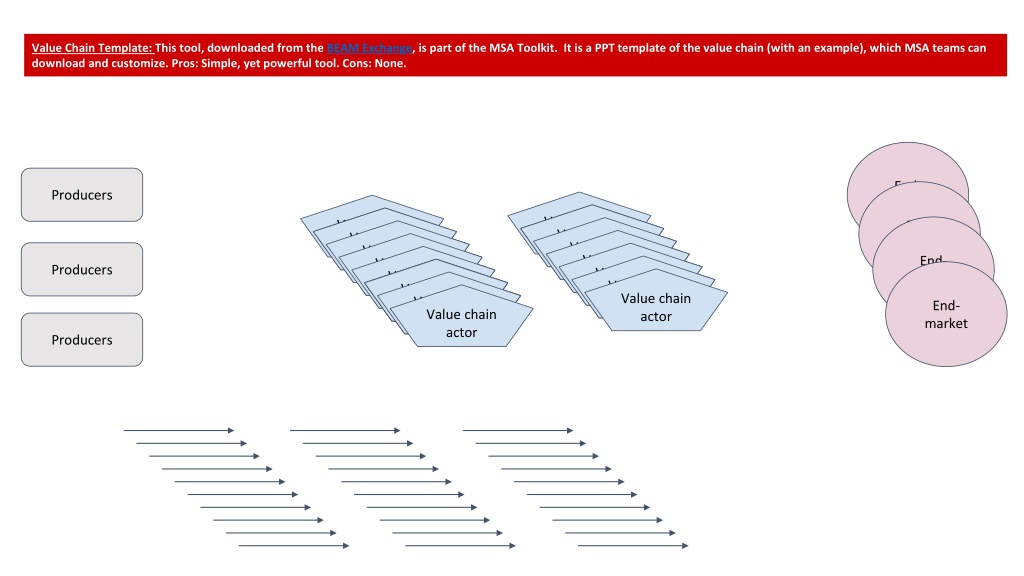
Value Chain Template: This tool, downloaded from the BEAM Exchange, is part of the MSA Toolkit. It is a PPT template of the value chain (with an example), which MSA teams can download and customize. Pros: Simple, yet powerful tool. Cons: None. End- market End- market Producers Value chain actor Value chain actor Value chain actor Value chain Value chain actor Value chain Value chain actor Value chain actor Value chain actor Value chain Value chain actor Value chain Value chain actor Value chain actor Value chain Value chain actor Value chain actor Value chain End- market Producers actor actor Value chain actor actor Value chain actor actor actor Value chain actor actor Value chain actor actor actor Value chain actor actor Value chain actor Value chain Value chain actor Value chain actor Value chain Value chain End- market Producers
Estimated # of actors in red RICE Value Chain Diagram 20% sticky rice for consumption 80% Jasmine rice sale/cash Rice seed chain 1.2% projected growth of sector in Thailand Farmer and/or farmer groups not producing own rice seed Input supply company Rice Seed Department Not all products (ex. Tanks and poly pipes) Cooperatives Rice Seeds Farmer group 320 177 UR 41 Sriskaet 67 Yasothon 36 A.C. Rice seed Domestic retail chain (ex. Tesco) Rice millers Domestic consumers Farmers 550K Rice cooperatives Smallholder 1-15 rai Export market Trader / broker / agent All farmers 322,000 - U.R. 26,000 Srisaket 100,000 Yastothon 76,000 A.C. Collectors and agents Exporter (ex. PFA) Retail, wholesale, local shop Community enterprise Packaging and branding company 3.7K 1,235 U.R. 1,406 Srisaket 397 Yasothon 667 A.C. Rice entrepreneur & branding Organic rice chain
SANITATION Value Chain Diagram Plan, Live&Learn, Caritas, World Vision, JICA MPS/SIG 2 NGOs 5 H Antony Veke and Bodo Dettke Importer Only in the past, not by all NGOs and not since new RWASH Policy H 20+ Retailer (owned by manufacturer/impo rter) Honiara Hardware, TONGS, ITA, Changs, Island Enterprise, LKP, EKD, Bowman s, Bishop Brothers, etc. 20+ Schools 30+ in NW/W Guale Consumers: community and households H H Independent retailer Manufacturer 5+ 15 Clinics Solomon Sheet Steel, Lee Quo Quin, LKP, HCC, Individual Trades Persons 90 communities 10 in NW/W Guale 15,000 HH or 60,000 people H Construction Companies 15 Churches 90 NW/W Guale Land Resources (rural areas) Independent Trades person (service) 30+ in NW/W Guale = no exchange of $ Ex: timber, gravel, sand, stones, sago palm H = Honiara (location) Estimated # of actors in red
HYGIENE Value Chain Diagram 10 big, 30+ smaller Wholesaler/Distributor (Importers) H 10 Importer H Retailers owned by importers Big: CDL, George Wu, Bulk Shop, Low Price, ABBA, Talu, Kasu, Fengs Smaller: White Angel, Gao Ming, etc. H 20 Village Canteen 100+ in NW/W Guale H + Visale Wholesaler/Distributor (non-importers) 30+ H + Visale Consumers: community and households 90 communities Retailers owned by wholesalers H 60 Manufacturer 6+ Schools 30+ in NW/W Guale Soap: KPSI, STP, Chottu, Market women Sanitary Pads: MJ, Bethesda, DIVIT Toilet Paper: Hiway (Ranandi) H + Visale Independent Retailers 15,000 HH or 60,000 people 100+ Clinics 10 in NW/W Guale Retailer owned by manufacturers Input Suppliers H 1 Soap: VCO, Copra oil, etc. Sanitary Pads: fabric, snap buttons, etc. = no exchange of $ KPSI H = Honiara (location) Estimated # of actors in red