
SN65DSI85-Q1 Layout Review
In-depth analysis and review of the layout design for the 2026 Nissan CDC Headunit utilizing the SN65DSI85-Q1 system. The review includes detailed information on various layers such as Layer1 to Layer10, the schematic representation, and the block diagram outlining the PMIC Cluster ASIL-B setup. Key
0 views • 13 slides

Comprehensive Guide to 8085 Microprocessor Interrupts and Pin Diagram
Explore the PIN diagram of the 8085 microprocessor, understand interrupts, including hardware interrupts like TRAP, RST, INTR, and the classification of interrupts such as maskable, non-maskable, vectored, and more. Learn about the sequence of steps during interrupts and their significance in microp
12 views • 31 slides

HR Diagrams in Astronomy
HR diagrams, named after astronomers Hertzsprung and Russell, depict stars' properties and relationships. The main sequence in the diagram shows where stars lie while fusing hydrogen to helium in their core. Learn about different types of stars and their positions on the diagram. Explore the signifi
1 views • 27 slides

Comprehensive Guide to Electric Circuits and Circuit Diagram Interpretation
Explore the fundamentals of electric circuits, circuit components, and diagram interpretation. Learn about series and parallel circuits, resistors, sources, switches, transducers, and more. Discover how to calculate resistance, current, and potential difference in circuits. Gain insights into diodes
2 views • 76 slides

Comprehensive Guide to IEC1131-3 Ladder Diagram Programming
The origins of ladder diagram programming trace back to the graphical representation of electrical control systems, evolving from relay logic to logic circuits and finally incorporating CPUs for control decisions. A ladder diagram consists of rungs containing input and output instructions, executing
0 views • 21 slides
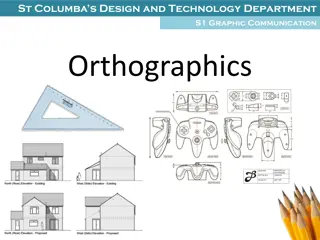
Orthographic Drawing in Design and Technology Education
Delve into the world of orthographic drawing through St. Columba's Design and Technology Department's S1 Graphic Communication program. Discover the significance of orthographics in visualizing 3D objects as 2D drawings, learn about orthographic views like Elevation, Plan, and End Elevation, and exp
0 views • 8 slides
Tonal Shading Drawing Techniques Lesson for Upper KS2
Develop your drawing technique in creating tone with light, medium, and dark tones using cross-hatching, blending, and stippling. Apply these techniques to make objects appear 3D. Explore the importance of tone in drawing, experiment with different shading techniques, and apply them to compositions.
6 views • 6 slides
Advanced Diagram Development and Management Project Summary
The Advanced Diagram Development and Management project aims to integrate a software architecture for inputting data and automating the process of developing and managing functional diagrams in naval shipbuilding. The project goals include reducing labor costs, minimizing errors on drawings, and enh
1 views • 28 slides
Pixel Array Status and Drawing Rules for High-Resistivity Epi Design
This collection of images and descriptions provides an overview of the pixel array status as of April 26, 2019, along with drawing rules for high-resistivity epi design. The pixel array features various components such as Pixel_S1, Pixel_S3, and the overall array structure. Drawing rules highlight t
4 views • 9 slides

Scatter Diagram Method for Correlation Analysis
Scatter Diagram Method is a simple and effective way to study the correlation between two variables. By plotting data points on a graph, it helps determine the degree of correlation between the variables. Perfect positive and negative correlations, as well as high and low degrees of correlation, can
0 views • 11 slides
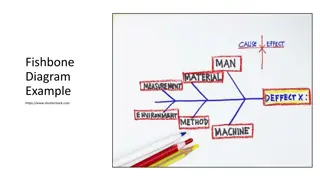
Examples of Fishbone, Mind Map, and Concept Map Diagrams
Visual examples of Fishbone Diagrams, Mind Maps, and Concept Maps are provided in the content. Each diagram is showcased with detailed descriptions and image URLs. Explore these examples to enhance your understanding of these diagram types.
0 views • 6 slides
Symmetrical DDA and Bresenham's Line Drawing Algorithm
The content discusses the Symmetrical DDA (Digital Differential Analyzer) and Bresenham's Algorithm for line drawing in computer graphics. Symmetrical DDA generates lines from differential equations, while Bresenham's Algorithm iteratively changes coordinate values to draw lines effectively. The pro
0 views • 11 slides
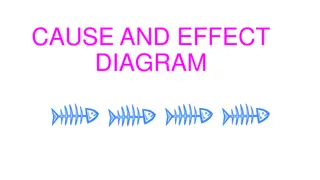
Fishbone Diagrams: A Visual Problem-Solving Tool
Learn about the Fishbone Diagram, also known as the Cause and Effect Diagram, its purpose, construction, and how it helps in identifying and analyzing the root causes of a problem through a structured approach. This visual tool aids in brainstorming ideas, categorizing causes, and understanding the
0 views • 14 slides

Data Flow Diagram: Introduction and Construction in Industrial Engineering
This content explores the concept of Data Flow Diagrams (DFD) in the context of creating a Master's Degree Program in Industrial Engineering for Thailand's smart industry. It discusses the benefits of DFD, techniques for diagram decomposition, and the formalization of DFD rules for consistency check
0 views • 10 slides

Analysis of NGC Base HV Breakdown Study and Voltage Divider Diagram
The NGC Base HV breakdown study identifies potential workmanship issues affecting sparking in a 60% Neon-40% Argon atmosphere near +2000V. Recommendations include checking and redoing signal and ground attachments, along with hi-potting HV cables to 3000V. Switching to 60% Neon/40% Argon prompts a c
1 views • 14 slides
Drawing Capabilities in Pygame: Shapes, Multimedia, and More
Utilize Pygame to go beyond drawing rectangles and explore drawing circles, lines, shapes of any format, and importing images. Enjoy playing music and multiple sounds simultaneously. Learn about useful functions in the Draw module and how to draw various shapes onto Surfaces using parameters and fun
0 views • 26 slides
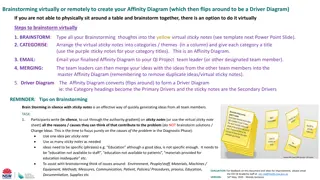
Virtual Affinity Diagram Creation for Remote Collaboration
When physical brainstorming sessions are not possible, teams can utilize virtual tools to create an Affinity Diagram remotely. Participants can brainstorm ideas on virtual sticky notes, categorize them, email the finalized diagram to team leaders, and then merge ideas into a Driver Diagram. This pro
0 views • 4 slides
Creating Interactive Drawing App in Flutter
Learn how to create an interactive drawing app in Flutter using GestureDetector for touch input, CustomPaint for rendering, and storing drawing information dynamically. Implement features like color selection, line width adjustment, and gesture detection to enable users to draw on the screen efficie
0 views • 19 slides
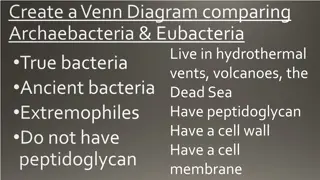
Comparison of Archaebacteria & Eubacteria Venn Diagram
Archaebacteria and Eubacteria are two types of bacteria with distinct characteristics. Archaebacteria are ancient bacteria that are extremophiles, living in harsh environments like hydrothermal vents and volcanoes, lacking peptidoglycan. On the other hand, Eubacteria are true bacteria with peptidogl
0 views • 60 slides

How to Draw a Systems Diagram: Step-by-Step Guide for a Simple Example
Identify system components, characterize their behavior, draw linkages, and consider additional details to create a comprehensive systems diagram. Follow basic steps and a simple example of heating a room to understand the process effectively.
0 views • 9 slides

Introduction to Engineering Drawing and Techniques
Engineering drawing is a fundamental aspect of communicating ideas and designs in the fields of Mechanical, Electrical, and Civil Engineering. This form of visual communication utilizes lines to represent object surfaces, edges, and contours. Various drawing methods such as Freehand, Instrument-base
0 views • 55 slides

Introduction to Engineering Drawing Language and Drawing Tools
Engineering Drawing Language uses lines to depict object surfaces, edges, and contours, while Freehand Drawing is sketched without instruments. Drawing Instruments ensure precise drawings to scale. Learn to draw horizontal and vertical lines, and angles using drawing tools like T-Square and triangle
0 views • 29 slides

Nature Drawing Tasks for Art Class
Complete a series of nature drawing tasks including recreating shells, creating skull drawings, experimenting with mark making techniques, and working on charcoal drawings. Reflect on your work to improve and develop your drawing skills further.
0 views • 6 slides
Raster Graphics and Scan Conversion in Computer Graphics
This lecture covers various topics related to raster graphics and scan conversion in computer graphics. It includes issues with scan converting a line, generalized line drawing algorithms, and the midpoint circle drawing algorithm. Additionally, it explores deriving mathematical expressions for draw
0 views • 21 slides
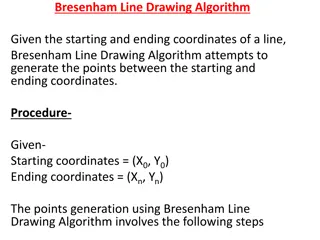
Bresenham Line Drawing Algorithm Explained with Examples
Bresenham Line Drawing Algorithm is a method used to generate points between starting and ending coordinates to draw lines efficiently. This algorithm involves calculating parameters, decision parameters, and iteratively finding points along the line. Two example problems are provided with step-by-s
0 views • 8 slides
Master AutoCAD 2021 Drawing Tools and Techniques
Explore the powerful features of AutoCAD 2021 including drawing tools for setting limits, line weight adjustments, hatch tool for generating hatch lines, and gradient application. Learn how to set drawing limits, customize line weights, and optimize your drawings efficiently in AutoCAD. The tutorial
0 views • 8 slides
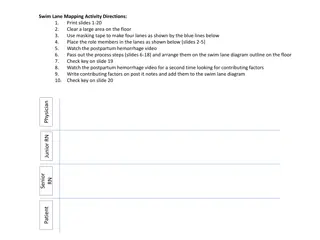
Postpartum Hemorrhage Simulation Activity with Swim Lane Mapping
Prepare for a postpartum hemorrhage simulation activity by printing slides, setting up a floor diagram with masking tape lanes, and arranging role members. Watch instructional videos, analyze contributing factors, and place process steps on the diagram. Follow key instructions, identify key actions
0 views • 20 slides
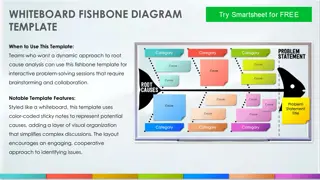
Interactive Fishbone Diagram Template for Collaborative Root Cause Analysis
This fishbone diagram template styled like a whiteboard is perfect for teams looking for a dynamic approach to root cause analysis. It encourages interactive problem-solving sessions through brainstorming and collaboration, featuring color-coded sticky notes for visual organization and simplifying c
0 views • 6 slides
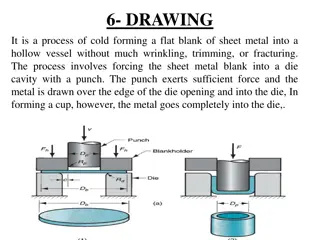
Metal Drawing Process for Creating Hollow Vessels
Metal drawing is a cold forming process that transforms a flat sheet metal blank into a hollow vessel without wrinkles or fractures. By applying force with a punch, the metal is drawn into a die cavity to shape the blank into a cup-like form. This process involves setup similar to blanking but with
0 views • 19 slides

Discover Your Dream Job with the Flower Diagram
Uncover your ideal career path through the innovative Flower Diagram method. This PowerPoint project, adapted from "What Color is Your Parachute?", guides you through identifying your values, transferable skills, favorite knowledge areas, preferred working environments, desired level of responsibili
0 views • 17 slides
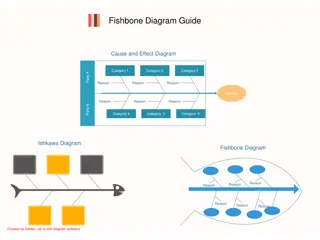
Comprehensive Guide to Fishbone Diagrams for Effective Problem-solving
The fishbone diagram, also known as the cause and effect diagram or Ishikawa diagram, is a powerful tool used to identify all possible causes of a problem in a business process. This guide covers the definition, history, benefits, and tips for creating fishbone diagrams, along with information on fi
0 views • 12 slides

E-R Diagram and Normalization Analysis for Online Telephone Sales System
This content provides detailed information on the creation of an information system for tracking orders in an online telephone sales company. It includes system requirements, entity identification, attribute listing, relationship identification, and normalization analysis for second and third normal
0 views • 10 slides

Class Diagram University Degrees System
The class diagram depicts the relationships between faculties, departments, degrees, courses, and students in a university system where students enroll in courses to obtain degrees administered by specific departments. The diagram illustrates the entities and their associations within a university s
0 views • 17 slides
Bresenham's Circle Drawing Algorithm Explained
Bresenham's Circle drawing algorithm is a fast and efficient method for drawing circles using integer arithmetic. It divides the circle into octants and selects the nearest pixel positions to create smooth arcs. This algorithm is widely used for graphics applications due to its speed and accuracy.
0 views • 15 slides

Conditional Probability and Venn's Diagram
Delve into the concepts of conditional probability and Venn's diagram, exploring how they help analyze dependent events and logical relations between sets. Learn about calculating probabilities in scenarios like different colored pencils in a box and coin toss outcomes, illustrated with examples and
0 views • 10 slides

Create 3-Circle Venn Diagram Quiz Questions in Moodle
This template by Dave Foord facilitates the creation of 3-circle Venn diagram quiz questions in Moodle. It requires the drag and drop markers plugin. Users can benefit from this free resource, but A6 Training and Consultancy Ltd cannot be held liable for any potential issues. Instructions and a help
0 views • 4 slides

Exploring Venn Diagram Challenges in Mathematics
Delve into the world of Venn Diagram challenges in mathematics, where students engage in tasks that involve filling regions with numbers based on specified criteria. Discover the versatility and educational value of these activities while honing your analytical and problem-solving skills.
0 views • 15 slides

Troubleshooting Eye Diagram Failure Issue with DP83822I in Fiber Optic Schematic
Utilizing the Tektronix MSO 70404C oscilloscope and differential probe for testing, the customer encounters failure in the eye diagram test with the DP83822 IC. Suggested solutions from the BU and potential configuration of Reg0x0027 register in DP83822I to meet the eye diagram test requirements are
0 views • 5 slides
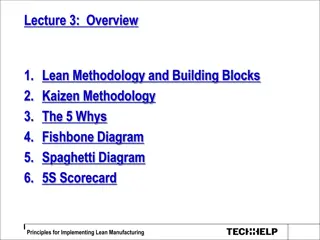
Introduction to Lean Methodology and Tools for Process Improvement
Lean methodology focuses on identifying and eliminating waste in operations to improve efficiency. Key tools such as Kaizen, 5 Whys, Fishbone Diagram, and Spaghetti Diagram are utilized for continuous improvement. The building blocks of Lean include Kaizen, Pull/Kanban, TPM, 5S System, and more. Und
0 views • 8 slides
Developing Drawing Techniques for Tone in Lower KS2 - Lesson 2
In this lesson, students will enhance their drawing skills by experimenting with techniques such as cross-hatching, blending, and stippling to create tone. They will learn about key terms like light, medium, dark, shadow, and highlight, and engage in activities that help them understand the importan
0 views • 5 slides