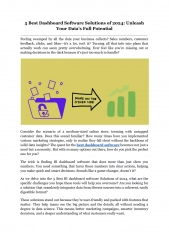
5 Best Dashboard Software Solutions of 2024_ Unleash Your Data's Full Potential
\nDiscover the 5 best dashboard software solutions of 2024 to transform your data into actionable insights. Find the perfect BI dashboard software for your business needs and unleash the full potential of your data with our expert guide.\n\n
4 views • 4 slides

A Data Analytics Company Could Be Your Most Valuable Partner_ Here's Why
Discover why partnering with a data analytics company could revolutionize your business strategy, improve operational efficiency, and drive growth. Learn from real success stories how a business analytics dashboard turns data into actionable insights.\n
1 views • 5 slides

Efficient Fraud Management with Data Analytics
Learn the importance of data analytics in fraud management and how it can streamline risk assessment, prevention, detection, audit planning, and investigation processes. Discover key areas where data analytics can make a difference and avoid common mistakes in your fraud analytics plan. Embrace data
2 views • 33 slides
The Ultimate BI Dashboard Tools Comparison_ Which One Is Right for Your Business_
Discover the best BI dashboard tool for your business with our comprehensive comparison. Find out which Business Intelligence dashboard platform aligns with your goals, from data visualization to advanced analytics, and make data-driven decisions with confidence.
3 views • 5 slides
Demystifying Data Analytics: Your Guide to Effective
\"Fixity EDX offers top-notch upskilling opportunities for students and professionals with data analyst, skill development, and corporate training programs. Gain high-quality skills and industry-recognized certification for enhanced career prospects.\" \n\nAre you intrigued by the vast potential of
1 views • 2 slides
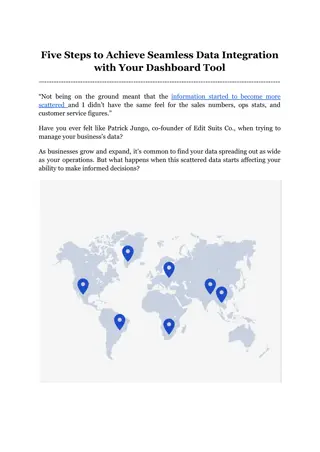
Five Steps to Achieve Seamless Data Integration with Your Dashboard Tool
\nFor your decisions to be derived from data, the ability to seamlessly integrate diverse data streams into a cohesive dashboard is more than a technical achievement; it's a competitive advantage. But what does it truly take to achieve seamless data integration with your Business Intelligence dashbo
5 views • 5 slides

Exploring Data Analytics: Introduction, Terminology, Challenges, Platforms, Tools, Applications
Delve into the world of data analytics through this comprehensive guide covering topics such as the definition of data, big data, analytics vs analysis, the importance of data analytics, real-world applications, and more. Explore the classification of data, the 3Vs of big data, and how data analytic
4 views • 39 slides

Harnessing Climate Data Analytics for Sustainable Supply Chain
In the end Vinz Global's dedication to using climate data analytics to build sustainable supply chains illustrates its ability to lead positive change and generating benefits for society and the environment. Through integrating climate data analytics into its business operations, Vinz Global gains i
10 views • 4 slides

Buy Car Dashboard Decor Items | Car Dashboard Accessories – theartarium
Order Car Dashboard Decor Accessories Online - Elegant & Premium Car Decor Idols to add a touch of modernity & class to your car. Shop Now only \n
7 views • 5 slides

Assessment and Accountability Information Meeting Highlights
Discover the key topics covered in the Assessment and Accountability Information Meeting on August 17, 2023, including insights on the California School Dashboard, tools for improvement, School Accountability Report Cards, and more. Learn about the Dashboard's significance in providing valuable data
2 views • 74 slides
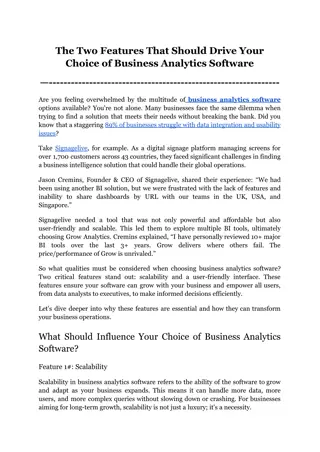
The Two Features That Should Drive Your Choice of Business Analytics Software
Choosing the right business analytics software is crucial for driving growth and efficiency. Two key features should be at the forefront of your decision: scalability and a user-friendly interface. Scalability ensures your business analytics dashboard software can handle increasing data volumes and
1 views • 7 slides
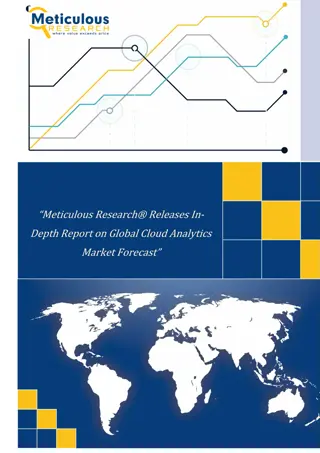
Meticulous Research® Releases In-Depth Report on Global Cloud Analytics Market Forecast
Cloud Analytics Market Size, Share, Forecast, & Trends Analysis by Offering (Solutions, Services), Type (Predictive Analytics, Diagnostic Analytics, Prescriptive Analytics), Deployment Mode, Sector (BFSI, Retail & E-commerce, Healthcare & Life Sciences), and Geography - Global Forecast to 2031\n
0 views • 4 slides
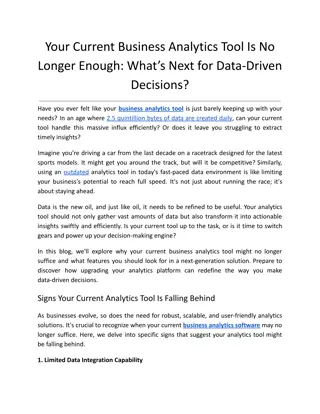
Your Current Business Analytics Tool Is No Longer Enough_ What’s Next for Data-Driven Decisions_
Discover why your current business analytics tool may no longer meet the demands of today's data-driven landscape. This blog explores the limitations of outdated analytics platforms and guides you through the essential features of next-generation tools that can enhance your decision-making capabilit
2 views • 7 slides

Virginia Perspective 2020 State Supervised Eligibility Dashboard
The implementation of Virginia Perspective 2020, a state-supervised and locally-administered program, involves notifying staff through agency broadcasts and email alerts to detect fraud. Eligibility workers receive alerts through VaCMS Dashboard for PARIS matches, ensuring timely actions on case eli
0 views • 10 slides

WebCMS 10.0 Dashboard Features and Functions
Explore the various functionalities of the WebCMS 10.0 Dashboard, including creating new proposals, viewing current proposals, accessing detailed information, and utilizing quick links for editing, approval, archiving, and exporting. The Dashboard provides a streamlined approach to managing programs
0 views • 19 slides

Professional Standards Management Information Dashboard - May 2022 Update
The May 2022 update of the Professional Standards Management Information Dashboard highlights an increase in new cases opened compared to previous years. Key Performance Indicators (KPIs) for 2022 are on track, with some improvements noted in the last quarter. The Registration and Accreditation Mana
0 views • 12 slides
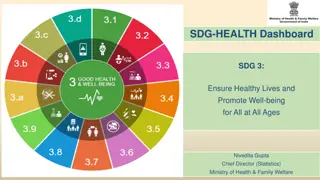
Monitoring Progress of SDG-3 Health Dashboard in India
In India, the Ministry of Health & Family Welfare is actively monitoring the progress of Sustainable Development Goal 3 (SDG-3) through the SDG Health Dashboard. The dashboard facilitates tracking of 73 health indicators, involving various stakeholder ministries. The National Task Force on SDG-3 ove
0 views • 7 slides

Developing a Teaching Portfolio for Online Doctoral Workshop on Supply Chain Analytics
In this workshop, distinguished panelists including Ananth Iyer, Apurva Jain, Subodha Kumar, and Yao Zhao share insights and expertise on supply chain analytics. Topics include program introductions, audience engagement, format, content criteria, and analytics applications. Participants will gain va
1 views • 7 slides

Impact of Data Analytics and Consulting Activities on Internal Audit Quality
This research examines how the use of data analytics and consulting activities affect perceived internal audit quality. The study investigates the relationship between these factors and top management's perception of internal audit quality. Through online scenario-based experiments with middle and t
2 views • 11 slides
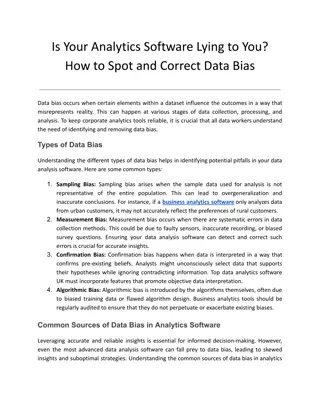
Is Your Analytics Software Lying to You_ How to Spot and Correct Data Bias
Data bias can distort your analytics and lead to misguided decisions. In this blog, learn how to identify common signs of data bias, understand its impacts, and explore effective strategies to correct it. Enhance the accuracy and reliability of your insights with practical tips and advanced tools, e
3 views • 8 slides

Healthy Longevity Dashboard for Sierra Leone
Sierra Leone faces challenges in life expectancy and healthcare access, with high rates of child and maternal mortality. The Healthy Longevity dashboard aims to monitor and guide investments in non-communicable diseases (NCDs) and health longevity by tracking indicators across various domains in the
0 views • 15 slides

Unleashing the Power of Business Analytics for Enhanced Decision-Making
Businesses are leveraging data and analytics capabilities to transform decision-making processes. This shift has been driven by the availability of vast amounts of data, improved computational power, and sophisticated algorithms. The incorporation of business analytics in various sectors like market
0 views • 9 slides
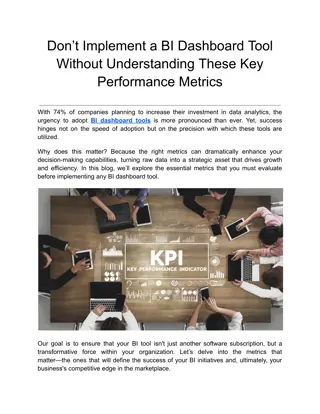
Don’t Implement a BI Dashboard Tool Without Understanding These Key Performance Metrics
Explore the crucial metrics essential for maximizing the effectiveness of BI dashboard tools in our latest blog. Before you implement a BI dashboard, discover which performance indicators are vital to understand, ensuring that your data works as hard
0 views • 5 slides
Leveraging Predictive Analytics in Mobile App Development_ Enhancing User Experience and Retention
Discover how predictive analytics is transforming the mobile app development landscape in our latest blog, How Predictive Analytics is Shaping the Future of Mobile App Development. By leveraging data and machine learning models, predictive analytics
0 views • 4 slides
A Guide to Talking with Parents About the California School Dashboard
This guide is designed for site administrators to effectively communicate information to parents regarding the California School Dashboard. It covers an overview of the dashboard, details on measures, school performance data, and available parent resources. The deck provides customization tips to ta
0 views • 19 slides
Understanding Dashboard Terminology for December 2020
Exploring the dashboard terminology for December 2020, including concepts like the orange ring of dartboard for domain tabs, the center and rings of dartboard on domain tabs, the green ring of dartboard for Mori Health Equity Report, and more. Learn about the significance of different indicators and
0 views • 11 slides

Enhancing Dashboard Creativity and Widget Usage for Effective Data Management
Explore the world of creative dashboards and worthwhile widgets in this session led by Shelly Rheinfrank. Learn how to change existing dashboards, add new ones, use and create widgets, and deploy navigation tips and tricks. Discover the art of customizing dashboards, adding new dashboards with a spe
0 views • 19 slides
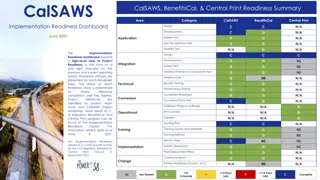
CalSAWS Implementation Readiness Dashboard Summary
The CalSAWS Implementation Readiness Dashboard provides a high-level view of project readiness for CalSAWS, BenefitsCal, and Central Print. It includes status indicators for various readiness areas, key project milestones, and risks. The dashboard reflects data as of June 4, detailing progress in de
0 views • 9 slides

Monitoring Lift Passenger Traffic in EMSD HQS
Submission by Karmo International Company Limited for EMSD E&M InnoPortal focusing on monitoring lift passenger traffic in EMSD HQS. The project entails logging lift lobbies' density, suggesting passengers use less crowded lifts, and displaying lift lobby status on a web-based dashboard. Required da
0 views • 8 slides

Stream Processing for Incremental Sliding Window Analytics
This content explores the design requirements, state-of-the-art technologies, trade-offs, goals, and approach for achieving efficient incremental processing in stream analytics. It emphasizes the need to balance advantages of batch-based systems with the efficiency of incremental updates for sliding
0 views • 37 slides

Understanding Analytics for Target (A4T) Integration
Analytics for Target (A4T) is a powerful cross-solution integration that enables you to create target activities based on Analytics conversion metrics and audience segments. This integration utilizes Analytics reports for result examination and drives optimization program analysis. A4T provides valu
0 views • 33 slides
MHCLG Online Data Dashboard - Empowering Better Decision Making
Revolutionize the way data is accessed and utilized within the MHCLG through the Online Data Dashboard. This comprehensive tool provides easy access to performance metrics, visualizations, and key outcomes across various policy areas. From tracking progress to enabling policy development and enhanci
0 views • 11 slides
Business Analytics Program at Wake Tech Community College
Wake Tech Community College offers an Associate in Applied Science degree program in Business Analytics. The program aims to prepare students for careers in analytics fields such as Business Intelligence, Marketing Analytics, Finance Analytics, and Logistics Analytics. With a focus on employability,
0 views • 13 slides
Real-Time Fleet Management and Data Visualization Dashboard
Chris Lambert from ITS developed a comprehensive real-time dashboard system for snow and ice management. The system aims to publish accurate and timely information, provide real-time fleet management, and visualize rolling data. It offers features like unlimited roll-back, automation of record-keepi
0 views • 24 slides
Implementing Library Analytics at Lancaster University
Lancaster University Library, through the leadership of John Krug, Systems and Analytics Manager, has embraced analytics to enhance operations and decision-making. With the implementation of Alma and the development of analytics dashboards, the library is utilizing data from various sources such as
0 views • 17 slides
Building a Custom Workload Dashboard with Netanel Ferdinaro
Learn how to create a personalized workload dashboard with Netanel Ferdinaro. Follow the step-by-step instructions to customize your dashboard, add data sources, and configure display settings. Enhance your monitoring capabilities and analyze workload performance efficiently.
0 views • 9 slides

The Importance of Web & Mobile App Analytics in Modern Business.
The Importance of Web & Mobile App Analytics in Modern Business emphasizes how analytics helps businesses understand user behavior, improve engagement, and make data-driven decisions. It covers key tools like Google Analytics, Mixpanel, and practical
0 views • 13 slides
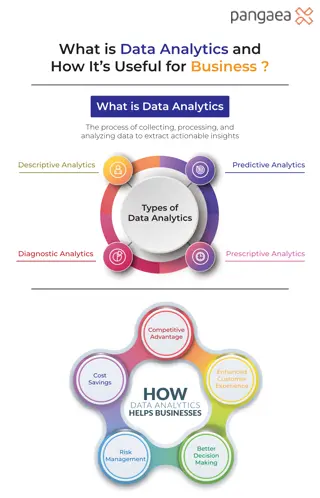
What is Data Analytics and How It’s Useful for Business
Data analytics involves collecting, processing, and analyzing data to extract actionable insights. It includes descriptive, diagnostic, predictive, and prescriptive analytics. For businesses, data analytics helps improve decision-making, reduce costs
0 views • 1 slides
Cloud Analytics Market Meticulous Research® Forecasts $135.4 Billion by 2031
Cloud Analytics Market Size, Share, Forecast, & Trends Analysis by Offering (Solutions, Services), Type (Predictive Analytics, Diagnostic Analytics, Prescriptive Analytics), Deployment Mode, Sector (BFSI, Retail & E-commerce, Healthcare & Life Scienc
0 views • 4 slides
Enhancing Learning Through Co-Created Interactive Courseware and Learning Analytics
Explore the innovative concept of co-creation in interactive courseware and learning analytics to improve student learning outcomes. Discover how students collaborate in a social learning environment, track their progress, and engage in dialogic and constructive pedagogical strategies. Harness the p
0 views • 19 slides