Revolutionizing Asset Valuation: Longevity Specialty Finance, LLC's Competitive Advantage
Longevity Specialty Finance, LLC (LSF) is setting new standards in valuing level-3 assets and liabilities through their exclusive use of the Longevity Cost Calculator (LCC). The LCC, based on a proven longevity predictive algorithm, allows LSF to accurately price and value assets with unknown future maturity, leading to higher portfolio valuations. With a team of veteran professionals, LSF has managed portfolios worth over $3.5 billion in insurance, reverse mortgages, and pension assets. The LCC's accuracy stems from correlating patterns in co-dependent variables gathered over 20 years, resulting in precise future cash flow predictions.

Download Presentation

Please find below an Image/Link to download the presentation.
The content on the website is provided AS IS for your information and personal use only. It may not be sold, licensed, or shared on other websites without obtaining consent from the author. Download presentation by click this link. If you encounter any issues during the download, it is possible that the publisher has removed the file from their server.
E N D
Presentation Transcript
Longevity Specialty Finance, llc LSF s Competitive Advantage 1
Longevity Specialty Finance Setting new standards for valuing level-3 assets and liabilities LSF has the exclusive commercial rights to the Longevity Cost Calculator (LCC), a proven longevity predictive algorithm-based tool. LSF has a team of veteran life settlement professionals who have originated and managed L-3 portfolios of more than $3.5 billion of insurance death benefit, reverse mortgages, pension assets. LSF s Longevity Cost Calculator (LCC), that allows us to accurately price and value assets with unknowable future maturity. LCC accuracy allows LSF to predict future portfolio cash flows in a GAAP/SEC compliant methodology leading to higher portfolio valuations. 2
Longevity Cost Calculator The LCC LE is based on 76 questions developed for the NLTCS in 1980s. The model originator, Eric Stallard at Duke, was the actuary and demographer on the interdisciplinary team that spent a year developing the questions. 20,000 individuals ages 65-69 were consecutively assessed every 5 years for 4 consecutive assessments (20-years of progressive data). Data integrity was closely managed to yield clean data Stallard spent 10-years developing and validating the machine learning algorithms to evaluate the 30+ million co-dependent variables. The predictive value of the LCC comes from correlating patterns in co-dependent variables gathered consecutively over 20-years on the same individuals. 2007 the model was peer reviewed and published, 2009 Mazonas analyzed Stallard published papers to diagram, write code and validated the PC based model. 3
Longevity Cost Calculator Model was presented to the SEC in 2009 testimony. 2011 Mazonas, Stallard and Graham published the Bayesian Inference Level 3 valuation methodology at heart of SEC Rule 2a-5. Three times since 2010 the model s 96+% accuracy was been replicated. 2010,2014,2017 Grade of Membership (GoM) classification methodology used to calibrate responses Each LCC assessment completed in 10-minute telephone interview Immediate model output is individual s survival function curve and other scores 4
Key Predictor: Grade of Membership (GoM) Scoring The LCC question set generates 30 million co-dependent variables that need to be classified. This gave rise to the GoM classification system. An individual s total GoM score adds up to 1.0. Individuals usually have attributes of all 4 classifications. Occasionally the model experiences a Pure Type individual who is 1.0 in a single classification. GoM I Generally healthy with lowest level of impairments GoM II medical conditions, OTHERS WANT -Poorest subjective health, largest number of non-institutionalized, strong ADLs & Cognition, low mortality GoM III LSF WANTS -High mortality rates, few medical conditions, few impairments relatively good subjective health, poor ADLs & Cognition GoM IV High mortality rates, high levels of physical and cognitive disability and institutionalization 5
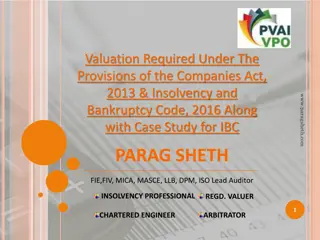
Grade of Membership (GoM) Scoring Relative GoM I through GoM IV Pure Type Survival Functions 6
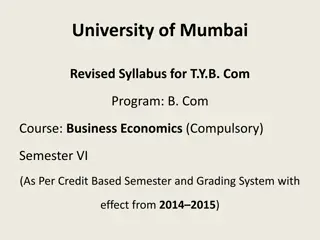
21st Services LE, AVS LE vs LCC LE Comparison of Available Data on Same Insured 1.000 0.900 0.800 0.700 LCC LE 4.9 Yrs 0.600 0.500 21st Services LE 12.5 yrs 0.400 0.300 AVS 17.5 Yrs 0.200 0.100 0.000 71 72 73 74 75 76 77 78 79 80 81 82 83 84 85 86 87 88 7
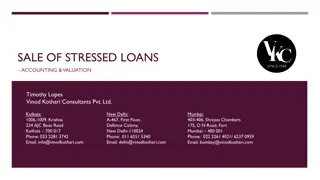
Comparative Life Expectancies for an Age 75 Female Various Mortality Factors Applied to VBT 2014 SOA Tables vs Longevity Cost Calculator GoM III @ 0.41 1.0 Female 75, LE 6.2 Years GoM I .00000 GoM II .45109 GoM III .40593 GoM IV .14298 1.00000 0.9 Usual LE Range by Others 0.8 0.7 Probability of Survival 0.6 Probable LCC LE Selection Range VBT2014 @ 100% Std 0.5 VBT2008 @ 150% 0.4 VBT2008 @ 200% LCC GoM III @ 0.41 0.3 VBT2014 @ 250% 0.2 0.1 0.0 75 77 79 81 83 85 87 89 91 93 95 97 99 101 103 105 107 109 Age Since Portfolio Aggregation 8
LCC is Key to GAAP Mark-to-Fair Value Methodology LCC GAAP compliant valuation methodology presented to SEC in 2009 Methodology peer reviewed and published in 2011 Paper quoted more than 45 times in technical papers 1. Methodology simple and uses 300 year-old Bayesian Inference math to support hypothesis that LCC is better predictor of LE than other methods 2. When consistently applied in portfolio valuation allows use of lower discount rate to NPV future portfolio cash flows the measure of portfolio value 3. Adds accretive incremental P&L book income and cumulative B/S asset value 9
$160 Million L-3 Portfolio Mark-to-Fair Value vs Mark-to-Market Comparison Policy Purchase Cost = $100 million (Ascribes No Value to Initial $60 million Cash Reserves) (Ascribes No Value to Initial $60 million Cash Reserves) Discount Rate Applied To Settlement Portfolio Balance Sheet Value 10% - Mark-to-Fair Value After Predictable Cash Flow Demonstrated 16% - Portfolio Cost - Breakeven 18.5% - Mark-to-Market if Can t Predict Cash Flows $200 Million $100 Million $ 65 Million 10
Contact Information Peter M. Mazonas, CPA Managing Member Level-3 Service Forensics, llc Peter.Mazonas@LSF-llc.com Dir: (415) 924-6269 Cell: (415) 279-7950 http://www.LSF-llc.net https://www.LSF-llc.com 11


 Scoring")