Medicare Advantage Plan Payment Rate Trends Over the Past Decade
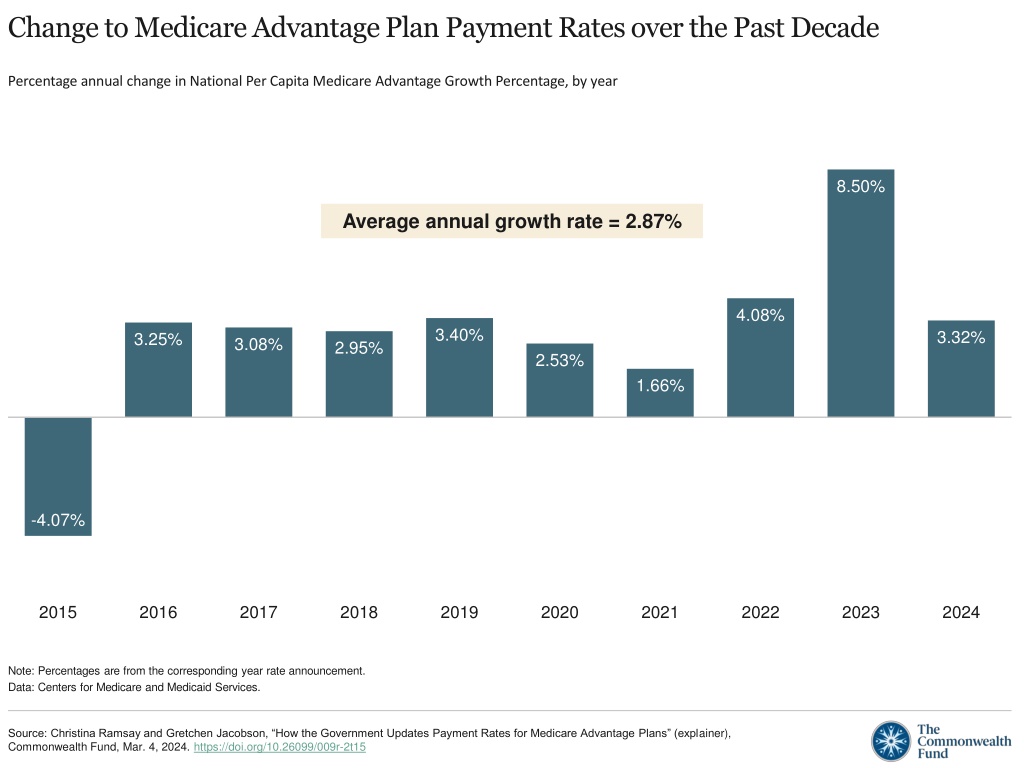
Analyzing the annual percentage changes in national per capita Medicare Advantage growth rates over the past decade reveals fluctuations in payment rates, with an average annual growth rate of 2.87%. The data reflects the evolving landscape of Medicare Advantage plan payments and policy updates. Through a timeline of annual payment updates and calculations of benchmarks and risk scores, the complex process of determining payments to Medicare Advantage plans is illustrated.

Download Presentation

Please find below an Image/Link to download the presentation.
The content on the website is provided AS IS for your information and personal use only. It may not be sold, licensed, or shared on other websites without obtaining consent from the author. Download presentation by click this link. If you encounter any issues during the download, it is possible that the publisher has removed the file from their server.
E N D
Presentation Transcript
Change to Medicare Advantage Plan Payment Rates over the Past Decade Percentage annual change in National Per Capita Medicare Advantage Growth Percentage, by year 8.50% Average annual growth rate = 2.87% 4.08% 3.40% 3.32% 3.25% 3.08% 2.95% 2.53% 1.66% -4.07% 2015 2016 2017 2018 2019 2020 2021 2022 2023 2024 Note: Percentages are from the corresponding year rate announcement. Data: Centers for Medicare and Medicaid Services. Source: Christina Ramsay and Gretchen Jacobson, How the Government Updates Payment Rates for Medicare Advantage Plans (explainer), Commonwealth Fund, Mar. 4, 2024. https://doi.org/10.26099/009r-2t15
Timeline of Medicare Advantage Annual Payment Updates MA plan quality star ratings are announced for next payment year CMS releases national average monthly bids, regional plan benchmarks, and other info Plans submit bids CMS publishes rate announcement, rate book, and BPT CMS publishes advance notice 30-day comment period By 1st Monday of April By 1st Monday of June Minimum 60 days before rate announcement Jul Sep Nov Dec Jun Oct Mar Apr Aug Feb May Nov Dec Jan OACT completes bid pricing review CMS s OACT and contracted actuaries review bid information and correspond with plans on any issues CMS publishes early preview of proposed policy changes LEGEND Key events Statutory timing requirements Note: BPT = bid pricing tool; OACT = Office of the Actuary. Data: Centers for Medicare and Medicaid Services. Source: Christina Ramsay and Gretchen Jacobson, How the Government Updates Payment Rates for Medicare Advantage Plans (explainer), Commonwealth Fund, Mar. 4, 2024. https://doi.org/10.26099/009r-2t15
Calculating the Benchmark for Payments to Medicare Advantage Plans County-level FFS per capita cost Average geographic adjustment Projected FFS USPCC x = Average and low-rated Medicare Advantage plans x = 0.95 to 1.15 CMS sets benchmarks at 95% to 115% of counties FFS spending levels Plans in counties with lower FFS spending have benchmarks set at higher percentages County-level FFS per capita cost County-level benchmark Highly rated Medicare Advantage plans x x = 0.95 to 1.15 1.05 to 1.10 Highly rated plans may see 5% 10% higher benchmarks Note: FFS = fee-for-service; USPCC = United States Per Capita Cost. Data: Centers for Medicare and Medicaid Services. Source: Christina Ramsay and Gretchen Jacobson, How the Government Updates Payment Rates for Medicare Advantage Plans (explainer), Commonwealth Fund, Mar. 4, 2024. https://doi.org/10.26099/009r-2t15
Calculating Risk Scores for Medicare Advantage Enrollees Dollar coefficient Marginal cost of each demographic characteristic and condition Relative factor = Predicted average FFS per capita costs In a specified year (the denominator year ) Beneficiary risk score Relative factor Relative factor Relative factor Relative factor Relative factor + = + + + Illustrative example: = + + + + 0.600 0.340 0.371 0.377 0.192 1.880 Male, Diabetes with chronic complications Congestive heart failure Acute myocardial infarction Diabetes and congestive heart failure interaction ages 70 74 Note: FFS = fee-for-service. Data (for illustrative example): Centers for Medicare and Medicaid Services, Report to Congress: Risk Adjustment in Medicare Advantage (CMS, Dec. 2021). Source: Christina Ramsay and Gretchen Jacobson, How the Government Updates Payment Rates for Medicare Advantage Plans (explainer), Commonwealth Fund, Mar. 4, 2024. https://doi.org/10.26099/009r-2t15
Basic Components of Medicare Advantage Plan Payments $ 1 CMS sets a benchmark, the maximum amount the federal government will pay plans per enrollee per county. Benchmarks increase 5% 10% for plans with 4 stars BENCHMARK 2 70% 4.5 or 5 stars REBATE 65% 3.5 or 4 stars A plan submits a bid, its estimated costs of covering the Medicare Parts A and B services for the average enrollee in each county. 50% 3 stars PLAN S BID 3 If a plan bids below the benchmark, it receives a portion of the difference in the form of a rebate. This can range from 50 percent to 70 percent, depending on the plan s quality star rating. Plans must use the rebate to lower out-of-pocket costs for enrollees or finance extra benefits. Data: Centers for Medicare and Medicaid Services. Source: Christina Ramsay and Gretchen Jacobson, How the Government Updates Payment Rates for Medicare Advantage Plans (explainer), Commonwealth Fund, Mar. 4, 2024. https://doi.org/10.26099/009r-2t15