Medicare Advantage Enrollment Trends and Payment Mechanisms
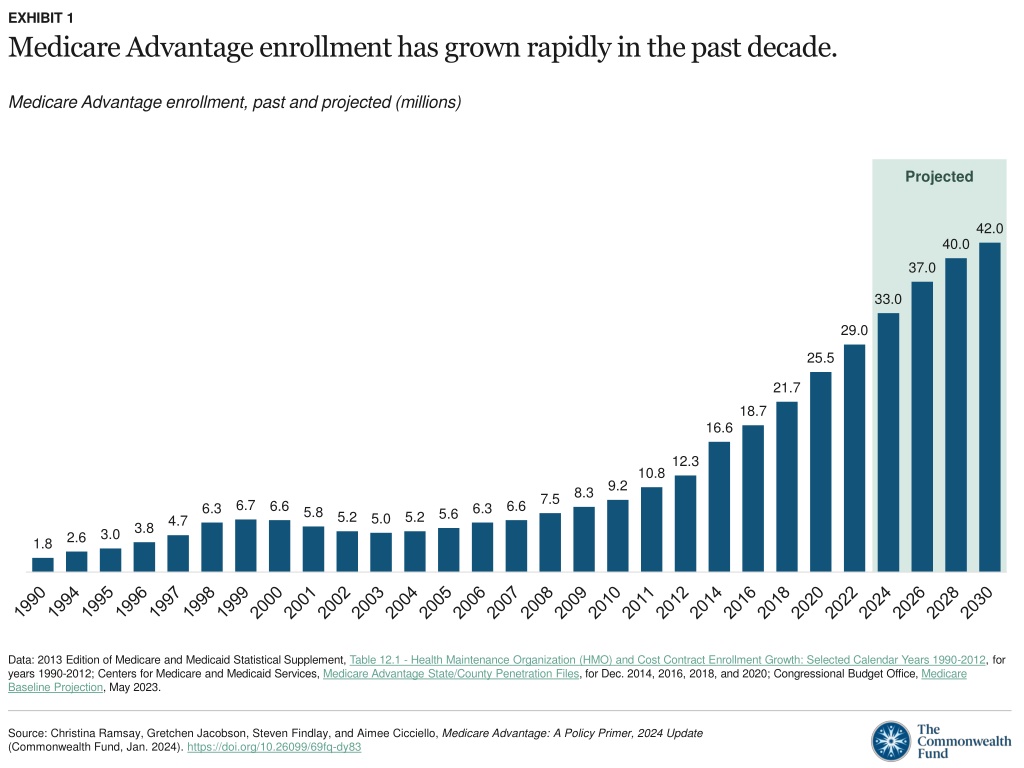
Medicare Advantage enrollment has significantly increased in the past decade, with payments being determined by benchmarks, bids, and quality incentives. The prevalence of chronic conditions is comparable between Traditional Medicare and Medicare Advantage, excluding Special Needs Plans. Dual-eligible and chronic-condition Special Needs Plans exhibit higher margins in comparison to other Medicare Advantage plans.
Download Presentation

Please find below an Image/Link to download the presentation.
The content on the website is provided AS IS for your information and personal use only. It may not be sold, licensed, or shared on other websites without obtaining consent from the author. Download presentation by click this link. If you encounter any issues during the download, it is possible that the publisher has removed the file from their server.
E N D
Presentation Transcript
EXHIBIT 1 Medicare Advantage enrollment has grown rapidly in the past decade. Medicare Advantage enrollment, past and projected (millions) Projected 42.0 40.0 37.0 33.0 29.0 25.5 21.7 18.7 16.6 12.3 10.8 9.2 8.3 7.5 6.7 6.6 6.6 6.3 6.3 5.8 5.6 5.2 5.2 5.0 4.7 3.8 3.0 2.6 1.8 Data: 2013 Edition of Medicare and Medicaid Statistical Supplement, Table 12.1 - Health Maintenance Organization (HMO) and Cost Contract Enrollment Growth: Selected Calendar Years 1990-2012, for years 1990-2012; Centers for Medicare and Medicaid Services, Medicare Advantage State/County Penetration Files, for Dec. 2014, 2016, 2018, and 2020; Congressional Budget Office, Medicare Baseline Projection, May 2023. Source: Christina Ramsay, Gretchen Jacobson, Steven Findlay, and Aimee Cicciello, Medicare Advantage: A Policy Primer, 2024 Update (Commonwealth Fund, Jan. 2024). https://doi.org/10.26099/69fq-dy83
EXHIBIT 2 Medicare Advantage payments are based on a system of benchmarks, bids, and quality incentives. Quality bonus High star ratings can increase benchmark and rebate Benchmark Set in statute as a percentage of per capita traditional Medicare spending in county Rebate Rebate Plans with bids below benchmark receive portion of difference; must be used to reduce enrollee expenses or finance supplemental benefits Risk adjustment Total annual payment for given beneficiary is risk adjusted based on enrollees health risk Plan bid Plans submit bids to cover Part A and Part B benefits for person of average health in given county Plan bid Source: Christina Ramsay, Gretchen Jacobson, Steven Findlay, and Aimee Cicciello, Medicare Advantage: A Policy Primer, 2024 Update (Commonwealth Fund, Jan. 2024). https://doi.org/10.26099/69fq-dy83
EXHIBIT 3 The prevalence of many chronic conditions is similar for enrollees in traditional Medicare and Medicare Advantage, after separating out Special Needs Plans. Percentage of beneficiaries with chronic condition Traditional Medicare Medicare Advantage Special Needs Plans 59 57 48 47 42 37 37 37 34 29 27 26 24 21 20 13 7 7 Arthritis (any) Cancer (any) CHF COPD Diabetes Depression Notes: Medicare Advantage plans as shown do not include Special Needs Plans (SNPs). CHF = congestive heart failure; COPD = chronic obstructive pulmonary disease, emphysema, and/or asthma. Across all listed chronic conditions, differences between SNPs and other types of Medicare coverage are significantly different, p<.05. Data represent community-dwelling beneficiaries. Beneficiaries in SNPs were determined using plan identifiers reported in the Medicare Current Beneficiary Survey. Data: Analysis of the Medicare Current Beneficiary Survey, 2018, as cited in Gretchen Jacobson et al., Medicare Advantage vs. Traditional Medicare: How Do Beneficiaries Characteristics and Experiences Differ? (Commonwealth Fund, Oct. 2021). Source: Christina Ramsay, Gretchen Jacobson, Steven Findlay, and Aimee Cicciello, Medicare Advantage: A Policy Primer, 2024 Update (Commonwealth Fund, Jan. 2024). https://doi.org/10.26099/69fq-dy83
EXHIBIT 4 Margins for dual-eligible and chronic-condition Special Needs Plans are higher compared to other Medicare Advantage plans. Medicare Advantage plans margins, by plan type, 2021 (%) 6.4 4.6 4.0 2.2 All MA plans D-SNPs C-SNPs I-SNPs Notes: MA = Medicare Advantage; SNP = Special Needs Plan; D-SNP = dual-eligible SNP; C-SNP = chronic condition SNP; I-SNP = institutional SNP. Margin calculation excludes quality improvement and fraud reduction activities as medical expenses. This figure excludes Part D and the following plan categories: employer group plans, the Medicare Medicaid demonstration plans, cost-reimbursed plans, Program of All-Inclusive Care for the Elderly, and medical savings account plans. Data: Medicare Payment Advisory Commission, The Medicare Advantage Program: Status Report, in Report to the Congress: Medicare Payment Policy (MedPAC, Mar. 2023). Source: Christina Ramsay, Gretchen Jacobson, Steven Findlay, and Aimee Cicciello, Medicare Advantage: A Policy Primer, 2024 Update (Commonwealth Fund, Jan. 2024). https://doi.org/10.26099/69fq-dy83
EXHIBIT 5 In about 75 percent of U.S. counties, beneficiaries have a choice of 20 or more Medicare Advantage plans. Percentage of U.S. counties with selected number of available Medicare Advantage (MA) plans Counties in U.S. with 0 plans Counties in U.S. with <10 plans 2 Counties in U.S. with 40+ plans 9 22 Counties in U.S. with 10 19 plans 14 Counties in U.S. with 20 39 plans Average number of MA plans per county = 30 54 Notes: Includes all 50 states, the District of Columbia, and Puerto Rico. Data for the following organization types are included: cost, local HMO, local PPO, MSA, PFFS, and regional PPO. PACE, Special Needs Plans, Part B Only Plans, and Employer sponsored plans (800 series) are excluded. Data: Centers for Medicare and Medicaid Services, Medicare Advantage Landscape Source File, CY2024; U.S. Census. Source: Christina Ramsay, Gretchen Jacobson, Steven Findlay, and Aimee Cicciello, Medicare Advantage: A Policy Primer, 2024 Update (Commonwealth Fund, Jan. 2024). https://doi.org/10.26099/69fq-dy83
