Understanding Topological Data Analysis (TDA) with Persistence Diagrams
Dive into the world of Topological Data Analysis (TDA) by learning how to install the TDA package on different operating systems and interpreting the plots of data points, barcodes, and persistence diagrams. Explore the visualization of cycles in different dimensions and understand the concepts of H0 and H1 in TDA. Discover the significance of the birth and death times of cycles and how they are represented graphically through bars, points, and triangles.

Download Presentation

Please find below an Image/Link to download the presentation.
The content on the website is provided AS IS for your information and personal use only. It may not be sold, licensed, or shared on other websites without obtaining consent from the author. Download presentation by click this link. If you encounter any issues during the download, it is possible that the publisher has removed the file from their server.
E N D
Presentation Transcript
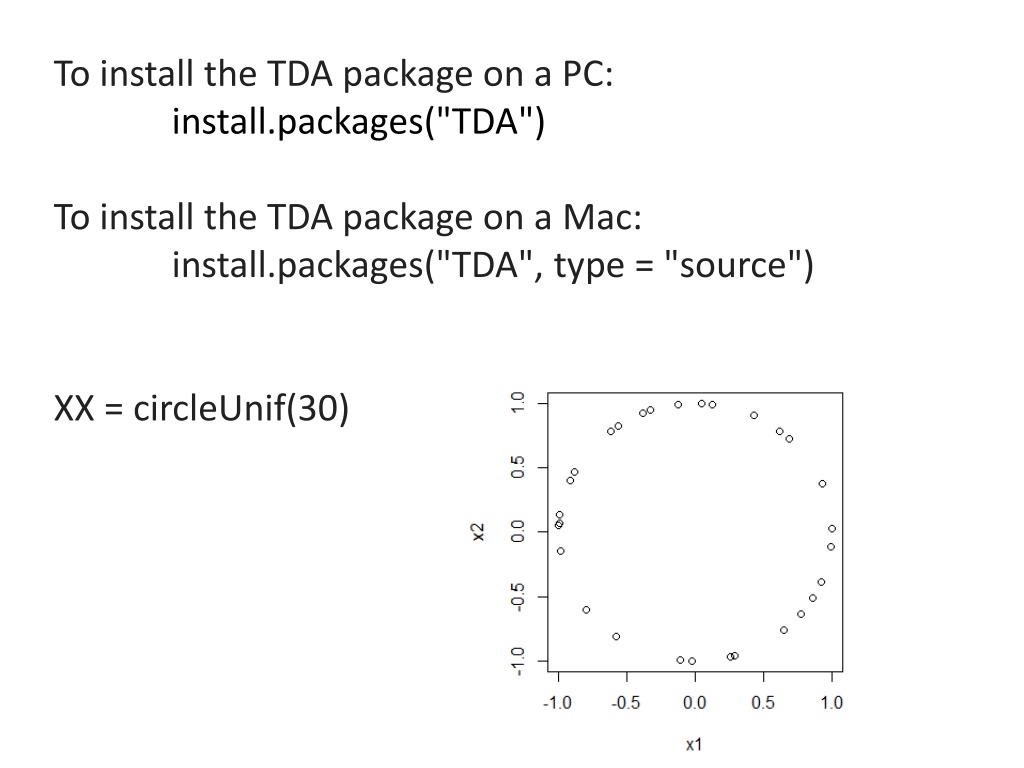
To install the TDA package on a PC: install.packages("TDA") To install the TDA package on a Mac: install.packages("TDA", type = "source") XX = circleUnif(30)
Plot of data points Barcode Each bar in the barcode represents a cycle in some Hi. The red bar represents the element in H1 (i.e., the circle = 1 dimensional cycle = sum of edges where the boundary of this sum = 0). Bars representing an element in H0 (i.e, 0-dimensional cycles = vertices) are drawn in black
Plot of data points Barcode Each bar in the barcode represents a cycle in some Hi. A bar starts at the birth time of the cycle it represents and ends at its death time.
Barcode A bar starts at the birth time of the cycle it represents and ends at its death time For each cycle in Hi = bar in barcode, we can plot the point (birth, death) where birth = birth time of this cycle death = death time of this cycle Black point = cycle in H0. Red triangle = cycle in H1.
Barcode A bar starts at the birth time of the cycle it represents and ends at its death time This plot of points (birth, death) is called the Persistence Diagram where we also throw in the diagonal.
H0 = < a, b, c, d : tc + td, tb + c, ta + tb> H1 = <z1, z2 : t z2, t3z1 + t2z2 > [ ) [ ) [ ) [ ) [ z1 = ad + cd + t(bc) + t(ab), z2 = ac + t2bc + t2ab
Since we cant plot (0, ), we instead plot (0, 5) where 5 = maximum time = maximum threshold = 3rd argument in ripsDiag(XX,maxdimension,maxscale, ) (3, 4) [ ) [ ) [ ) [ ) [ (1, 2) (2, 5) (0, 1) (0, ) (0, 5)
(3, 4) [ ) [ ) [ ) [ ) [ (0, 5) (1, 2) (2, 5) (0, 1)
(3, 4) [ ) [ ) [ ) [ ) [ (0, 5) (1, 2) (2, 5) (0, 1) Remember to add the diagonal
(3, 4) [ ) [ ) [ ) [ ) [ (0, 5) (1, 2) (2, 5) (0, 1) The diagonal will be useful when we compute distance between persistence diagrams Remember to add the diagonal
The homology of a circle is as follows: Rank of H0 = 1 since a circle has only one component Rank of H1 = 1 since a circle has a single 1-d component Rank of H2 = 0 since we don t have any 2-d circles.
The homology of a circle is as follows: Rank of H0 = 1 since a circle has only one component Rank of H1 = 1 since a circle has a single 1-d component Rank of H2 = 0 since we don t have any 2-d circles. This data set consists of 60 points randomly taken from a circle of radius 1. What should we expect the barcode to look like? What should we expect the persistence diagram to look like? Can we use TDA to determine that our points came from a circle
Can we use TDA to determine that our points came from a circle The homology of a circle is as follows: Rank of H0 = 1 since a circle has only one component Thus we expect 1 persistent (long) bar in the 0-dim barcode plus some shorter bars that we can ignore Rank of H1 = 1: circle has a single 1-d cycle that does not bound surface Thus we expect 1 persistent (long) bar in the 1-dim barcode plus possible some shorter bars that we can ignore Rank of H2 = 0 since we don t have any 2-d ccles. Thus we expect 0 persistent (long) bars in the 2-dim barcode plus possible some shorter bars that we can ignore
The homology of a circle is as follows: Rank of H0 = 1 since a circle has only one component Thus we expect 1 persistent (long) bar in the 0-dim barcode plus some shorter bars that we can ignore Rank of H1 = 1: circle has a single 1-d cycle that does not bound surface Thus we expect 1 persistent (long) bar in the 1-dim barcode plus possible some shorter bars that we can ignore Rank of H2 = 0 since we don t have any 2-d ccles. Thus we expect 0 persistent (long) bars in the 2-dim barcode plus possible some shorter bars that we can ignore
Our data set = 60 points randomly taken from a circle of radius 1 Can you determine from the barcode that our data set came from a circle? Do you see 1 persistent 0-dim cycle? Do you see 1 persistent 1-dim cycle? Do you see 0 persistent 2-dim cycle? Does the persistent diagram make sense? 1 black point (cycle in H0) is far from the diagonal, while remaining black points are close to diagonal 1 red point (cycle in H1) is far from diagonal All blue points (cycles in H2) are close to diagonal
From the barcode: 1 persistent 0-dim cycle H0 = 1 1 persistent 1-dim cycle H1 = 1 No persistent 2-dim cycles H2 = 0 Ignore bars with small length Definition of small depends on dimension, data set, application, etc. From the persistent diagram: 1 black point far from the diagonal H0 = 1 1 red point far from diagonal All blue points close to diagonal H1 = 1 H2 = 0 Ignore points close to diagonal Definition of close depends on dimension, data set, application, etc.
On Thursday in B5 MLH you will explore the difference between circle and (circle + various amounts of noise)


, we instead plot (0, 5) where")
")
")
")