Understanding the Key Distinctions in Statistics
In statistics, the crucial difference between sample and population data shapes how we interpret information and draw conclusions. By generalizing sample data to the population, statisticians can estimate true means and variances with confidence. Sample means help us infer about the population, although they may not have the same distribution. Recognizing these distinctions is essential for accurate statistical analysis.

Download Presentation

Please find below an Image/Link to download the presentation.
The content on the website is provided AS IS for your information and personal use only. It may not be sold, licensed, or shared on other websites without obtaining consent from the author. Download presentation by click this link. If you encounter any issues during the download, it is possible that the publisher has removed the file from their server.
E N D
Presentation Transcript
Sampling Distributions Summer 2017 Summer Institutes 134
The most important distinction in statistics sample vs population When analysing data (or reading the literature), think about whether you want to discuss the sample that you observed or want to make statements that are more generally true Statistics is the only field that gives us the correct framework to generalise from our sample to the population Summer 2017 Summer Institutes 135
The most important distinction in statistics Example: T cell counts from 40 women with triple negative breast cancer were observed. What can we do with this information? Option 1: Discuss the 40 women. What was the mean T cell count? What was its variation? Option 2: Generalise the information about the 40 women to make statements about all women with triple negative breast cancer These are 2 different approaches to using the same information Summer 2017 Summer Institutes 136
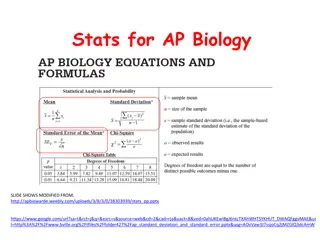
Language for making these distinctions Population Size N (usually ) Mean = = p X or j j Variance = 2 ( ) 2 = 2 p X or j j Sample Size n Sample Mean = X 1 n = = j X X j n 1 2s ( 1 = Sample variance = 2 1 ) n = 2 j s X X j 1 n Summer 2017 Summer Institutes 137
Generalising the sample to the population Issue: We can calculate the sample mean and sample variance from our data, but the true mean and true variance are generally unknown Fortunately, statisticians have learnt some things about how to recover* the true mean and true variance based only on sample means and sample variances * with high probability Summer 2017 Summer Institutes 138
How do sample means behave? Suppose we observe data X1, X2, ..., Xn. We can calculate X-bar exactly, but what can we say about ? Idea: is probably close to Xbar Goal: Make this more rigourous Summer 2017 Summer Institutes 139
Sums of Normal Random Variables In general, neither iXi nor Xbar will have the same distribution as the X s Example: X1, X2, X3 follow F-distributions. X1+ X2+ X3 does not follow an F- distribution (X1+ X2+ X3)/3 does not follow an F- distribution Exception to the rule: If X1, X2, ..., Xn are independent and normally distributed with means iand i2, X1+ +Xn follows a normal distribution with mean 1+ + n and variance 12+ + n2 Summer 2017 Summer Institutes 140
Central limit theorem What can we do instead? Use the central limit theorem! Central limit theorem: If X1, X2, ..., Xn are independent and have the same distribution, and the mean of that distribution is 2, then if n is large, X ~ N m,s2 n approximately and under relatively weak conditions. In general, this applies for n 30. As n increases, the normal approximation improves. Summer 2017 Summer Institutes 141
Distribution of the Sample Mean Population of X s (mean = ) X X X X X .4 .3 .2 .1 0 -4 -2 0 2 4 Summer 2017 Summer Institutes 142
Central Limit Theorem - Illustration Population .262 Fraction 0 0 10 20 30 x .276 Fraction 0 0 5 10 15 Means of size 5 Summer 2017 Summer Institutes 143
.165 Fraction 0 2 4 6 8 Means of size 10 .19 Fraction 0 3 4 5 6 7 Means of size 30 Summer 2017 Summer Institutes 144
Central limit theorem The central limit theorem allows us to use the sample (X1 Xn) to discuss the population ( ) We do not need to know the distribution of the data to make statements about the true mean of the population! Summer 2017 Summer Institutes 145
Distribution of the Sample Mean EXAMPLE: Suppose that for Seattle sixth grade students the mean number of missed school days is 5.4 days with a standard deviation of 2.8 days. What is the probability that a random sample of size 49 (say Ridgecrest s 6th graders) will have a mean number of missed days greater than 6 days? Summer 2017 Summer Institutes 146
Find the probability that a random sample of size 49 from this population will have a mean greater than 6 days. = 5.4 days = 2.8 days n = 49 = = = / / 8 . 2 49 4 . 0 n X 4 . 5 = X 4 . 5 X 6 ( ) = 6 P X P X 4 . 0 X ( ) = 5 . 1 = 0668 . 0 P Z Summer 2017 Summer Institutes 147
Sampling distribution of (for samples of size 49) X Population distribution 1 0 -3 13.8 = 4 . 5 = X Summer 2017 Summer Institutes 148
Exercise What is the probability that a random sample (size 49) from this population has a mean between 4 and 6 days? Summer 2017 Summer Institutes 149
Solution = 5 . 3 ) 5 . 1 4 ( P ) 6 ( X P Z = ) 5 . 1 ) 5 . 3 ( ( P Z P Z = . 933 Summer 2017 Summer Institutes 150
Confidence Intervals Summer 2017 Summer Institutes 151
Confidence Intervals Confidence intervals are not just intervals! (L, U) is a 100p% confidence interval for a parameter means that For any possible correct value parameter , the interval (L, U) contains with probability at least p. Confidence parameters. intervals only concern Prediction intervals (different!) are intervals about random variables. Summer 2017 Summer Institutes 152
Confidence Intervals for the mean Because , X ~ N m,s2 n we know that =0.95. P -1.96 X -m +1.96 s / n Rearranging gives us that is a 95% confidence interval for the true mean Summer 2017 Summer Institutes 153
Confidence Intervals known If we desire a (1 - ) confidence interval we can derive it based on the statement 2 2 1 / X Z Z = 1 P Q Q n 1 2 Z Z 2 Q That is, we find constants exactly (1 - ) probability between them. and that have Q A (1 - )Confidence Interval for the Population Mean + X n 2 2 1 Z Z + , X Q Q n Summer 2017 Summer Institutes 154
Confidence Intervals known - EXAMPLE Suppose distributed with a standard deviation of 6 days. A sample of 30 second time mothers yield a mean pregnancy length of 279.5 days. Construct a 90% confidence interval for the mean length of second pregnancies based on this sample. gestational times are normally Summer 2017 Summer Institutes 155
Confidence Intervals unknown To get a CI for using the methods outlined above, we need X and 2. But usually, is unknown - we only have X and s2. It turns out that even though X ) ( n is normally distributed, ( ) X s n is not (quite)! W.S. Gosset worked for Guinness Brewing in Dublin, IR. He was forced to publish under the pseudonym Student . In 1908 he derived the distribution of X ( ) s n which is now known as Student s t-distribution. Summer 2017 Summer Institutes 156
Normal and t distributions Summer 2017 Summer Institutes 157
Confidence Intervals 2 unknown t Distribution When is unknown we replace it with the estimate, s, and use the t-distribution. The statistic X / s n has a t-distribution with n-1 degrees of freedom. We can use this distribution to obtain a confidence interval for even when is not known. A (1- ) Confidence Interval for the Population Mean when is unknown s/ n a 2 1-a X+tn-1 s/ n, X+tn-1 2 ( ) ( ) Summer 2017 Summer Institutes 158
Confidence Intervals - 2 unknown t Distribution - EXAMPLE Given our 30 moms with a mean gestation of 279.5 days and a variance of 28.3 days2, we can now compute a 95% confidence interval for the mean length of pregnancies for second time mothers: Summer 2017 Summer Institutes 159
Confidence Intervals - sample variance Q: Can we derive a confidence interval for the sample variance? A:Yes. We ll need the Chi-square distribution Definition: The sum of squared independent standard normal random is a random variable with a Chi-square distribution with n degrees of freedom. Let Zi be standard normals, N(0,1). Let n = + + + = 2 1 2 2 2 2 = i X Z Z Z Z n i 1 X has a 2(n) distribution Summer 2017 Summer Institutes 160
Chi-square Distribution Properties of 2 (n): Let X ~ 2(n). 1. X 0 2. E[X] = n 3. V[X] = 2n 4. n, the parameter of the distribution is called the degrees of freedom. Summer 2017 Summer Institutes 161
Chi-square Distribution Sample Variance The Chi-square distribution describes the distribution of the sample variance. Recall 2 1 ( ) n = 2 = i s X X i 1 n 1 and 2 2 X X s n ( ) = = i 1 i n 2 1 Now the right side almost looks like 2 X n = i i 1 which would be 2(n). Since is estimated by one degree of freedom is lost leading to ( ) 2 ~ 1 X 2 s n 2 with n-1 degrees of freedom Summer 2017 Summer Institutes 162
Chi-square Distribution Confidence Interval for 2 We can use the Chi-square distribution to obtain a (1 - ) confidence interval for the population variance. 2 2 2 n 1 2 s n 1 ( ) = 1 1 P Q n Q ( ) ( ) 1 2 2 Now, inverting this statement yields: / 1 n Q n s P 2 2 2 1 1 n ( ) ( ) = 2 2 2 1 / 1 s n Q ( ) ( ) 1 2 Therefore, A (1 - ) Confidence Interval for the Population Variance 1 1 ( ) ( ) ) 2 2 2 n 1 / , 1 / s n Q s n Q 2 ( ) ( 1 n 2 2 Summer 2017 Summer Institutes 163
Chi-square Distribution Confidence Interval for 2 - Exercise Suppose for the second time mothers were not happy using the standard deviation of 6 days since it was based on the population of all mothers regardless of parity. The sample variance was 28.3 days2. What is a 95% confidence interval for the variance of the length of second pregnancies? Summer 2017 Summer Institutes 164
Summary General (1 - ) Confidence Intervals. Confidence intervals are only for parameters! CI for , assumed known Z. CI for , unknown T. CI for 2 2 confidence wider interval sample size narrower interval Summer 2017 Summer Institutes 165