Comprehensive Overview of FY24 Budget for Municipal Services
The FY24 budget for municipal services totals $351.2M, showcasing a significant increase compared to the previous year. Key highlights include investments in workforce development, fire and police programs, street rehabilitation projects, and affordable housing initiatives. The budget also focuses on enhancing community services and infrastructure, with detailed breakdowns of revenues and expenditures included.

Download Presentation

Please find below an Image/Link to download the presentation.
The content on the website is provided AS IS for your information and personal use only. It may not be sold, licensed, or shared on other websites without obtaining consent from the author. Download presentation by click this link. If you encounter any issues during the download, it is possible that the publisher has removed the file from their server.
E N D
Presentation Transcript
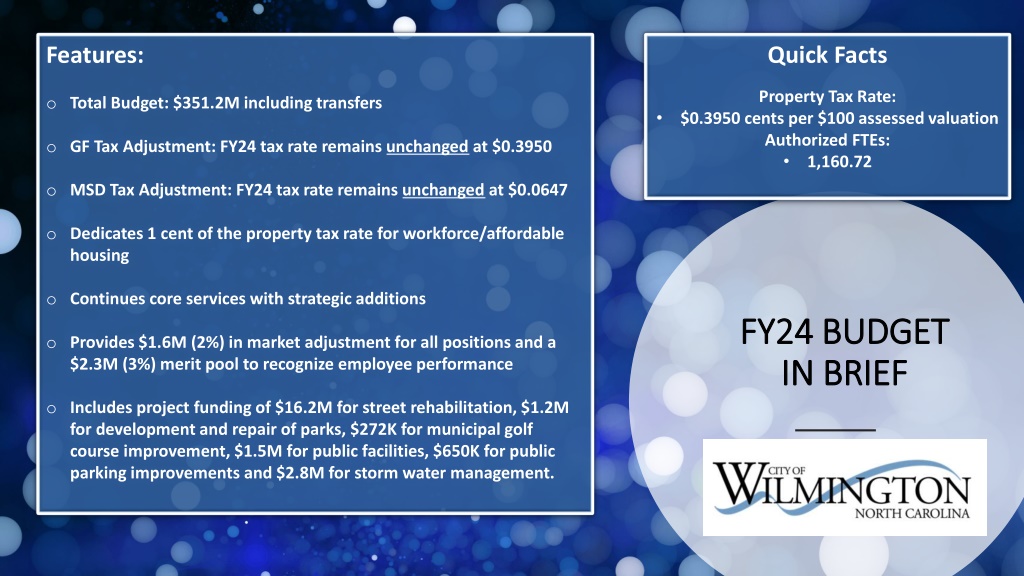
Features: Quick Facts Property Tax Rate: o Total Budget: $351.2M including transfers $0.3950 cents per $100 assessed valuation Authorized FTEs: 1,160.72 o GF Tax Adjustment: FY24 tax rate remains unchanged at $0.3950 o MSD Tax Adjustment: FY24 tax rate remains unchanged at $0.0647 o Dedicates 1 cent of the property tax rate for workforce/affordable housing o Continues core services with strategic additions FY24 BUDGET FY24 BUDGET IN BRIEF IN BRIEF o Provides $1.6M (2%) in market adjustment for all positions and a $2.3M (3%) merit pool to recognize employee performance o Includes project funding of $16.2M for street rehabilitation, $1.2M for development and repair of parks, $272K for municipal golf course improvement, $1.5M for public facilities, $650K for public parking improvements and $2.8M for storm water management.
Developed around the latest Vision, Mission and Values, the FY24 budget totals $351.2M compared to FY23 adopted totaling $251.2M. The budget, less transfers between funds totals $316.4M and represents a 40% or $90.1M increase over FY23. Executive Staff City Manager Tony Caudle Deputy City Managers Mary Vigue Chad McEwen Thom Moton Budget and Research Budget Director: Laura Mortell Sr. Analysts: Suzanne Gooding, Shawn Hunt & Maxine Wright Budget Specialist: Jane Horrell In addition to maintaining core services, major infinitives undertaken within this budget includes: o Investment in attracting and retaining a skilled workforce during a competitive and challenging labor market o Support to enhance fire and police programs necessary to maintain a safe, healthy and engaged community. o Increased funding to further improve city streets, sidewalks and road projects. City Council Mayor: Bill Saffo o Acquisition, relocation and consolidation of City services within the Northern Downtown Municipal Complex (NDMC) with no property tax increase o Continued support for affordable housing, job creation and economic development opportunities that contribute to creating a thriving community Mayor Pro Tem: Margaret Haynes Council Members: Neil Anderson Clifford D. Barnett Sr. Charles H. Rivenbark Kevin Spears Luke Waddell BUDGET MESSAGE BUDGET MESSAGE
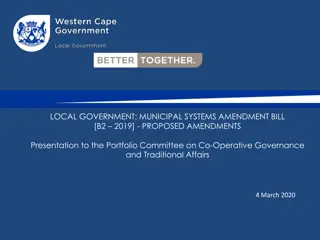
Total Budget: Revenues Total Budget: Revenues REVENUES AS A PERCENT OF TOTAL BUDGET REVENUE TYPE PROPERTY TAX OTHER FINANCING CHARGES FOR SERVICES SALES TAX INTERGOVERNMENTAL ROOM OCCUPANCY TAX INVESTMENTS, PERMITS, MISC FINES & FORFEITURES OTHER TAX TOTAL REVENUE REVENUE FUNDING (89,944,732.00) $ (124,480,144.00) $ (52,194,038.00) $ (45,487,437.00) $ (20,691,725.00) $ (5,957,489.00) $ (9,466,979.00) $ (2,498,003.00) $ (475,000.00) $ (351,195,547) $ OTHER TAX < 1% FINES & FORFEITURES 0.71% INVESTMENTS, PERMITS, MISC 2.70% ROOM OCCUPANCY TAX 1.70% INTERGOVERNMENTAL 5.89% SALES TAX 12.95% CHARGES FOR SERVICES 14.86% OTHER FINANCING 35.44% PROPERTY TAX 25.61% 0.00% 10.00% 20.00% 30.00% 40.00%
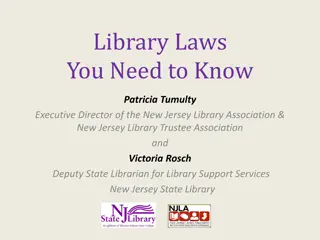
Total Budget: Expenditures Total Budget: Expenditures EXPENDITURES AS A PERCENT OF TOTAL BUDGET EXPENDITURE TYPE PUBLIC SAFETY GENERAL GOVERNMENT PROPRIETARY TRANSPORTATION OTHER FINANCING USES DEBT SERVICE CULTURAL & RECREATIONAL ECONOMIC & PHYSICAL DEVLP TRANSIT TOTAL EXPENDITURES EXPENDITURE FUNDING 66,538,427.00 $ 110,705,673.00 $ 51,823,156.00 $ 27,835,614.00 $ 40,644,081.00 $ 29,893,405.00 $ 13,122,239.00 $ 8,817,993.00 $ 1,814,959.00 $ 351,195,547.00 $ TRANSIT <1% ECONOMIC & PHYSICAL DEVLP <1% CULTURAL & RECREATIONAL 3.7% DEBT SERVICE 8.5% OTHER FINANCING USES 11.6% TRANSPORTATION 7.9% PROPRIETARY 14.8% GENERAL GOVERNMENT 31.5% PUBLIC SAFETY 18.9% 0.00% 10.00% 20.00% 30.00% 40.00%