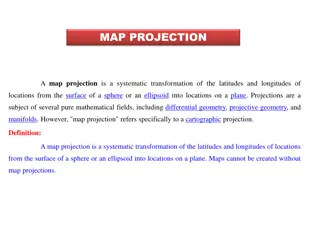
Budget Projection

Explore detailed insights into your company's budget projections, actual cost versus budget, month-wise budget forecasting, overhead cost analysis, and quarterly budget analysis. Identify key variances, cost breakdowns, revenue trends, and budget allocation for informed decision-making and financial planning.

Download Presentation

Please find below an Image/Link to download the presentation.
The content on the website is provided AS IS for your information and personal use only. It may not be sold, licensed, or shared on other websites without obtaining consent from the author. Download presentation by click this link. If you encounter any issues during the download, it is possible that the publisher has removed the file from their server.
E N D
Presentation Transcript
Budget Projection Your Company Name
Actual Cost vs Budget 2 Actual Cost Difference in Figures % Comments on Variance Budget Variance Increase in raw material prices 150,000 120,000 30,000 25% Raw Material Cost Employee Cost Salary & Wages Maintenance Cost Finance Cost Electricity Cost Office Cost Administration charges Expense 1 Expense 2 Expense 3 Expense 4
Month Wise Budget Forecasting 3 Jan 2019 Feb 2019 Mar 2019 Apr 2019 Budget Actual Budget Actual Budget Actual Budget Revenues 4000- Sales 140 140 (3) (3) (16) (16) 214 4100- Consultation Services 1313 1,313 2,465 2,465 525 525 550 4300- Plant Health Care 1,275 1,275 4,599 4,599 7,691 7,691 7,691 4400- Tree Maintenance 27,333 27,333 10,946 10,946 17,423 17,423 17,423 4415- Pruning 60,721 52,801 76,456 66,484 90,745 78,908 78,908 4420- Tree Removal 10,719 10,719 8,872 8,872 9,040 9,040 9,040 Total Revenues 101,501 93,581 103,334 93,361 125,407 113,571 101,501 Direct Costs 5000- Cost of Doing Business 508 520 620 270 752 350 971 5100- Materials & Supplies 2,132 160 2,170 432 2,634 668 3,397 5200- Labour - - - - - - - 5205- Field Wages 35,766 23,690 35,766 25,011 36,533 25,656 36,533 5210- Field Wages Overtime 2,842 792 2,893 651 3,511 2,227 4,530
Overhead Cost Budget Analysis 4 Manufacturing Overhead Costs Q1 Forecast Q1 Actual Variance Variance % Indirect Labour Management Salaries (Fixed Cost) $90,000 $92,000 $2,000 2.2% Hourly Wages (Variable Cost) $690,000 $756,000 $66,000 9.6% Plant & Infrastructure Floor Space Leasing (Fixed Cost) $12,000 $12,000 $0 0.0% Insurance (Fixed Cost) $10,000 $10,000 $500 5.0% Maintenance (Variable Cost) $220,000 $225,000 $5,000 2.3% Utilities (Variable Cost) $12,000 $14,000 $2,900 24.2% Total Manufacturing Overhead $ $1,034,000 $1,110,000 $76,400 7.4%
Quarterly Budget Analysis 5 This Quarter Year-to-Date Budget Item Budget Actual Variance Budget Actual Variance Sales Revenue $500,000 $550,000 $50,000 $1,000,000 $1,200,000 $200,000 Cost of Sales 30,000 320,000 20,000 600,000 640,000 40,000 Gross Profits $200,000 $230,000 $30,000 $400,000 $560,000 $160,000 Variable Expenses Selling Expenses $100,000 $120,000 $20,000 $200,000 $240,000 $40,000 Inspection 10,000 8,000 20,000 16,000 (2,000) (4,000) Total Variable Expenses $110,000 $128,000 $18,000 $220,000 $256,000 $36,000 Fixed Expenses Rent $60,000 $70,000 $10,000 $120,000 $150,000 $30,000 Depreciation 20,000 19,000 40,000) 38,000 (1,000) (2,000) Total Fixed Expenses $80,000 $89,000 $9,000 $160,000 $188,000 $28,000 Income from Operations $10,000 $13,000 $3,000 $20,000 $116,000 $96,000 Interest Income 2,000 3,000 1,000 4,000 6,000 2,000 Interest Expenses 1,000 1,500 500 2,000 3,000 1,000 Net Income Before Taxes $7,000 $8,500 $1,500 $14,000 $107,000 $93,000 Taxes 2,000 15,000 4,000 3,000 (500) (1,000) Net Income After Taxes $5,000 $7,000 $2,000 $10,000 $104,000 $94,000 Non-Income Statement Items Loan Repayments 14,000 13,000 28,000 26,000 (1,000) (2,000) Owner Withdrawals (Or Dividends) 5,000 5,000 5,000 5,000 25,000 5,000 Fixed Asset Expenditures 100,000 90,000 100,000 90,000 (10,000) (10,000)
Master Budget vs Actual: Variance Analysis 6 Uncle Grumps Quarterly Budget 2002 Budget 2002 Actual Variances Variable Costs: Raw Materials $1,800 7,200 $7,255 $55 U Direct Labor 3,848 15,392 17,530 $2,138 U Indirect Labor 300 1,200 1,366 166 U Supplies 75 300 290 F ($10) Power 375 1,500 1,550 $50 U U Fixed Costs: Repairs & Maintenance 300 1,200 1,030 F ($170) Depreciation 700 2,800 2,800 $0 U Insurance 250 1,000 1,003 $3 U $7,648 $30,592 $32,824 $2,232 U Units Produced 500 2000 2,050
Actual vs Budget Analysis 7 Original Budget Variable Cost Per Unit Flexible Budget Original Budget/ 100,000 Average Cost X 125,000 Production 100,000 Units 125,000 Units Indirect Materials $50,000 $0.50 62,000 Indirect Labor 40,000 0.40 50,000 Utilities 40,000 0.40 50,000 $130,000 $1.30 $162,500 Total
Actual vs Target Variance 8 Job Cost Budget Variation Revenue Budget Variation Profit Prp Add (113) 0.00 0.00 0.00 0.00 0.00 0.00 0.00 Prp Add (125) 0.00 0.00 0.00 0.00 0.00 0.00 0.00 Prp Add (130) 0.00 0.00 0.00 0.00 0.00 0.00 0.00 Prp Add (1324356) 0.00 0.00 0.00 0.00 0.00 0.00 0.00 Prp Add (435435) 0.00 0.00 0.00 0.00 0.00 0.00 0.00 Prp Add (498789) 0.00 0.00 0.00 5,150.00 0.00 5,150.00 5,150.00 Prp Add (EXHIB01) 43,560.00 0.00 (43,560.00) 0.00 0.00 0.00 (43,560.00) 43,560.00 0.00 (43,560.00) 5,150.00 0.00 5,150.00 (38,410.00)
Budget vs Plan vs Forecast 9 Approved Original Budget Budget Approved Changes Current Budget Budget Projected Budget Current Commitments WBS Variance Pending Changes Clearance & Development 1,500.00 0,00 1,500.00 0,00 1,500.00 1,500.00 0.00 Structure Construction Work 18,000.00 0,00 18,000.00 0,00 18,000.00 18,000.00 0.00 Technical Facilities 5,000.00 0,00 5,000.00 0,00 5,000.00 5,000.00 0.00 External Works & Technical Facilities Outside 3,000.00 0,00 3,000.00 0,00 3,000.00 3,000.00 0.00 Furnishing & Artistic Appointments 5,500.00 0,00 5,500.00 0,00 5,500.00 5,500.00 5,000.00 Incidental Building Costs 12,000.00 0,00 12,000.00 0,00 12,000.00 12,000.00 0.00 CASH Line 22,000.00 0,00 22,000.00 0,00 22,000.00 22,000.00 0.00 Oven 21,500,00 8,500,00 29,500,00 0,00 29,500,00 29,500,00 8,500,00 AGV Equipment 1,000.00 0,00 1,000.00 0,00 1,000.00 1,000.00 0.00 Cranes 3,000.00 0,00 3,000.00 0,00 3,000.00 3,000.00 0.00 Logistics 1,000.00 0,00 1,000.00 0,00 1,000.00 1,000.00 0.00 Auxiliary Equipment 3,000.00 0,00 3,000.00 0,00 3,000.00 3,000.00 0.00 Operational Costs/ EHS/ Trainee 3,000.00 0,00 2,000.00 0,00 2,000.00 2,000.00 1,000.00 IT & System Integration 2,000.00 0,00 2,000.00 0,00 2,000.00 2,000.00 0.00 Contingency 4,000.00 0,00 4,000.00 0,00 4,000.00 0.00 4,000.00 Total 105,000.00 8,500.00 113,500.00 0,00 113,500.00 95,000.00 18,500.00
Forecast vs Actual Budget 10 Irrigation Setup Quantity Unit Cost Total Cost Life Annual Cost Mainline (10 PVC) 10 Section $2.10 $21.00 20 $1.05 Laterials (1/2 Poly) 1 $120.00 $120.00 10 $12.00 1000 roll PVS Fittings (risers) 40 Fitting $0.49 $19.60 10 $1.96 Poly Tube Fittings 10 Fitting $0.54 $5.40 10 $0.54 Irrigation Pump (1 HP) 1 Pump $280.00 $280.00 5 $56.00 Pump Fittings 4 Fittings $8.00 $32.00 10 $3.20 Pressure Regulator 1 Fitting $12.50 $12.50 5 $2.50 Mesh Filter 1 Filter $18.00 $18.00 1 $18.00 Cistern (2500 gallon) 1 Cistern $1,324.95 $1,324.95 20 $66.25 Drip Emitters (500 Total) 2 Bag $62.50 $125.00 5 $25.00 Zip Ties (1000 Ties) 1 Bag $24.50 $24.50 5 $4.90 Total Irrigation Material Costs $1,982.95 $191.40 Irrigation Labor Dig mainline trench 3 Hour $9.70 $29.10 20 $1.46 Install mainline 15 Hour $9.70 $145.50 20 $7.28 Zip Tie Laterials 4 Hour $9.70 $38.80 20 $1.94 Install Drip Emitters 7 Hour $9.70 $67.90 20 $3.40 Cistern & Pump Setup 3 Hour $9.70 $29.10 20 $1.46 Irrigation Labor Cost Hour $9.70 $310.40 $15.52 Total Irrigation Cost $2,293.35 $206.92
Forecast and Projection 11 2019 Feb Mar Apr May Budget Actual Budget Actual Budget Actual Budget Actual Revenue 1,500.00 0.00 2,500.00 0.00 4,000.00 00,000 4,000.00 0.00 Sales Miscellaneous Income 400.00 0.00 400.00 0.00 300.00 00,000 200.00 0.00 1,900.00 0.00 2,900.00 0.00 4,300.00 00,000 4,200.00 0.00 Total Revenue Expenses 3,586.67 240.00 3,586.67 9,882.00 3,586.67 886.00 3,586.00 0.00 Employee Cost 0.00 0.00 0.00 0.00 0.00 00,000 0.00 0.00 0.00 0.00 0.00 0.00 0.00 00,000 0.00 0.00 0.00 0.00 0.00 0.00 0.00 00,000 0.00 0.00 3,586.67 240.00 3,586.67 9,882.00 3,586.67 886.00 3,586.67 0.00 Total Expenses Purchases 0.00 0.00 0.00 0.00 0.00 00,000 0.00 0.00 0.00 0.00 0.00 0.00 0.00 00,000 0.00 0.00 0.00 0.00 0.00 0.00 0.00 00,000 0.00 0.00 Total Purchases 0.00 0.00 0.00 0.00 0.00 00,000 0.00 0.00 Project Profit -1,686.67 -240.00 -686.67 -9,882.00 713.33 -886.00 613.33 0.00
Budget vs Forecast vs Actual 12 Budget Spent Remaining Cost Amount Cost Amount Description Hours/ Units Hours/ Units Hours/ Units Amount Status 30.00 $900.00 $0.00 30.00 $900.00 Under Professional Services 10.00 $300.00 7.50 $337.00 2.50 $37.50 Client Conference/ Meeting Over 20.00 $500.00 $0.00 20.00 $,500.00 Under Consultant Coordination 9.00 $225.00 5.50 $192.00 3.50 $32.00 Under Liaison/ Coordination 20.00 $0.00 5.00 $300.00 15.00 $49.50 Marketing/ Sales Over 5.00 $75.00 1.50 $25.00 3.50 $205.00 Under Report/ Latter 40.00 $1,000.00 22.00 $795.00 18.00 $97.50 Under Research 10.00 $300.00 5.50 $202.00 5.50 $260.00 Under Review 50.00 $1,100.00 24.00 $840.00 26.00 $40.00 Under Site Inspection 40.00 $880.00 24.00 $840.00 16.00 $88.75 Under Site Measurement 15.00 $375.00 6.00 $286.00 8.50 $37.00 Under Telephone Call/ Conference 1,500.00 $150.00 226.00 $113.00 1,274.00 $216.52 Under Copy Services 10.00 $300.00 4.00 $83.00 6.00 $56.00 Under Special Deliver/ Courier 400.00 $200.00 512.00 $256.00 -112.00 $2.50 Mileage Over 40.00 $40.00 50.00 $37.00 -10.00 .00 Under Photograph 249.00 $5,655.00 100.00 $3,819.25 Total Services: 1,950.00 $690.00 792.00 $489.98 Total Expenses: Grand Total: $6,345.00 $4,309.23 $2,035,00 Under
14 Additional Slides
Clustered Bar 15 Product Product 01 02 25 Q4 45 40 Q3 50 47 Q2 25 52 Q1 15 0 10 20 30 40 50 60 Unit Count This graph/chart is linked to excel, and changes automatically based on data. Just left click on it and select Edit Data .
Line Chart 16 Product Product 01 02 Sales in percentage(%) 75 80 70 65 70 60 55 60 50 50 40 40 35 40 30 25 30 20 20 10 5 10 5 10 0 FY' 12 FY' 13 FY' 14 FY' 15 Financial years FY' 16 FY' 17 FY' 18 FY' 19 This graph/chart is linked to excel, and changes automatically based on data. Just left click on it and select Edit Data .
Our Team 17 Name Here Finance Manager Name Here CEO Name Here Product Manager This slide is 100% editable. Adapt it to your needs & capture your audience's attention. This slide is 100% editable. Adapt it to your needs & capture your audience's attention. This slide is 100% editable. Adapt it to your needs & capture your audience's attention.
Idea Generation 18 This slide is 100% editable. Adapt it to your needs and capture your audience's attention. This slide is 100% editable. Adapt it to your needs and capture your audience's attention. This slide is 100% editable. Adapt it to your needs and capture your audience's attention.
Puzzle 19 This slide is 100% editable. Adapt it to your needs and capture your audience's attention. This slide is 100% editable. Adapt it to your needs and capture your audience's attention. 04 02 05 03 01 This slide is 100% editable. Adapt it to your needs and capture your audience's attention. This slide is 100% editable. Adapt it to your needs and capture your audience's attention. This slide is 100% editable. Adapt it to your needs and capture your audience's attention.
20 Thank You Address # street number, city, state Contact Number 0123456789 Email Address emailaddress@123gmail.com