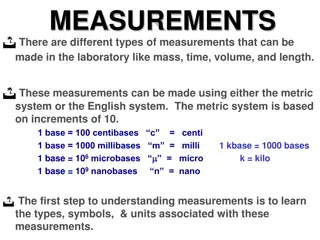
A Brief Overview of Mass Spectrometry and Its Historical Significance
Mass spectrometry is a powerful analytical technique used to determine the masses of particles. This summary provides insights into the history of mass spectrometry, key contributions by notable scientists, electron impact mass spectrometry, connection with gas chromatography, fragmentation patterns, and information derived from mass spectra.

Download Presentation

Please find below an Image/Link to download the presentation.
The content on the website is provided AS IS for your information and personal use only. It may not be sold, licensed, or shared on other websites without obtaining consent from the author. Download presentation by click this link. If you encounter any issues during the download, it is possible that the publisher has removed the file from their server.
E N D
Presentation Transcript
Lecture 4b Mass Spectrometry
History J. J. Thompson was able to separate two neon isotopes (Ne-20 and Ne-22) in 1913, which was the first evidence that isotopes exist for stable elements (Noble Prize 1906 in Physics, Discovery of the electron in 1897). F. W. Aston, who received the Noble Prize in Chemistry in 1922, discovered isotopes in a large number of nonradioactive elements by means of his mass spectrograph (first one build). He also enunciated the whole-number rule, which states that the masses of the isotopes are whole number multiples of the mass of the hydrogen atom. H. Dehmelt and W. Paul built the first quadrupole mass spectrometer in 1953 (Noble Prize 1989 in Physics). K. Tanaka and J.B. Fenn developed the electrospray and soft laser desorption method, which are used for a lot of proteins (Noble Prize 2002 in Chemistry). File:Discovery of neon isotopes.JPG
Electron Impact Mass Spectrometry I Electron Impact (EI) is hard ionization technique An ionizing beam of electrons generated in the ionization chamber causes the ionization and/or fragmentation of the molecule. The higher the energy of the electrons is, the more fragmentation is observed up to the point where the molecular ion (M+) cannot be observed anymore. vacuum 70 eV Magnetic Field (H) accelerator plates cathode Inlet From GC e- AB AB AB+ B+ AB+ A+ B+ AB+ A+ anode B+ Sample Chamber Ionizing Chamber AB+ AB+ AB+ Detector a
Electron Impact Mass Spectrometry II Mass spectrometers are often connected to gas chromatographs (GC/MS) to separate the compounds before they enter the mass spectrometer. They only require very small amounts of sample (~1 ng). The mass spectrometer employs an ultrahigh vacuum (<10-6 torr). Since there is only one detector, the magnetic field has to be scanned during the acquisition in order to collect ions with different m/z ratio, which arrive at different times. The neutral fragments do not interact with the magnetic field and are lost in the process (bounce into the walls):
Fragmentation I The mass spectrum is a plot of the relative ion abundance versus m/z (mass/charge, the charge for simple molecules is usually z= +1). The molecular ion peak (=parent peak) is the peak that is due to the cation of the complete molecule. The base peakis the largest peak in the spectrum (=100 %). Stevenson s rule: When a fragmentation takes place, the positive charge remains on the fragment with the lowest ionization energy: The more stable the fragment is, the higher the abundance of the ion is resulting in a larger peak because its lifetime is longer
Information from the Mass spectrum I Molecular Mass Presence of an odd number of nitrogen atoms (if molecular mass is odd) H3C C CH2CH3 N N OH N N N N H Mol. Wt.: 70 Mol. Wt.: 78 Mol. Wt.: 79 Mol. Wt.: 80 Mol. Wt.: 74 Mol. Wt.: 81 Presence of certain fragments that are due to very strong peaks i.e., benzyl, acylium, etc. Presence of certain functional groups due to fragments lost or observed i.e., alcohols exhibit a peak at m/z=31 due to [CH2OH]-fragment while at m/z=47 due to [CH2SH]-fragment
Information from the Mass spectrum II Structural information about the molecule can be obtained by analysis of lost fragments and the identification of stable ions in the mass spectrum
Information from the Mass spectrum III Number of carbon atoms from the ratio of [M+1]/[M]-peaks (1.1 % for each carbon) i.e., the ratio would be 11 % (=0.11) if there were ten carbon atoms in the fragment. The Mc Lafferty rearrangement is observed for carbonyl compounds with a longer chain. H XH X + H H O O + H3CO H3CO m/z=102 m/z=74
Information from the Mass spectrum IV If several chlorine and/or bromine atoms are present in the molecule, isotope clusters consisting of (n+1) peaks are found in the spectrum. Pattern for halogen clusters: X X2 X3 Elements Cl Br 100:32 100:98 100:64:10 51:100:49 100:96:31:3 34:100:98:32 Elements Br Br2 Cl 77:100:25 44:100:70:14 Cl2 61:100:46:6 38:100:90:32:4 Cl3 51:100:65:18:1.7 31:92:100:50:12:1
Caffeine Mass Spectrum (EI) The mass spectrum of caffeine displays peaks are m/z=194 (100), 109 (40), 82 (14), 67 (17) and 55 (17). http://svmsl.chem.cmu.edu/vmsl/Caffeine/images/caffeine_frag.gif


")