Mass Spectrometry Analysis of Lipid Species


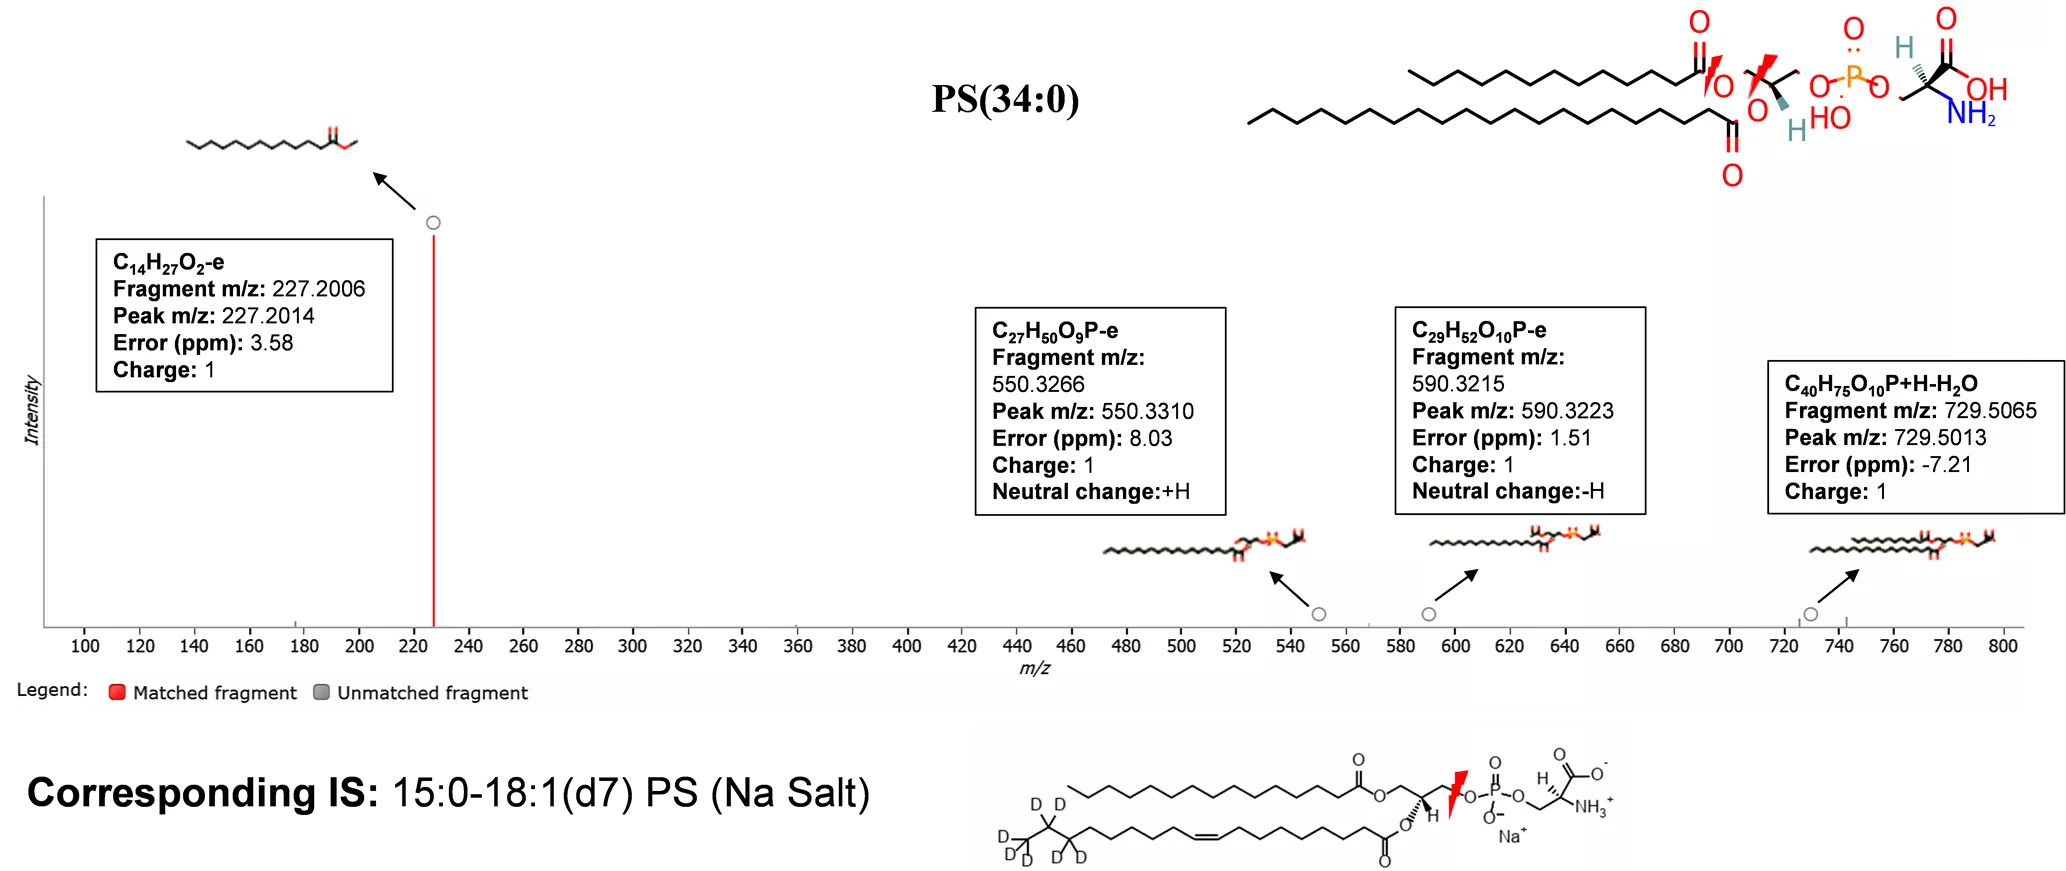
Figure S4. A. MS/MS spectrum of a precursor at m/z 746.5259 (ID: 0.97_746.5259m/z, RT=0.97 min) in positive mode with
adducts [M+H-H2O]
+
. The MS/MS spectrum was generated from MS
E
raw data using Progenesis QI software. Fragments
indicate that it’s PS(34:0). The lightning shape represents the site of bond breakage.
A


Figure S4. B. MS/MS spectrum of a precursor at m/z 426.3049 (ID: 0.95_426.3049m/z, RT=0.95 min) in positive mode with
adducts [M+2H]
2+
. The MS/MS spectrum was generated from MS
E
raw data using Progenesis QI software. Fragments
indicate that it’s PI (O-36:1). The lightning shape represents the site of bond breakage.
B
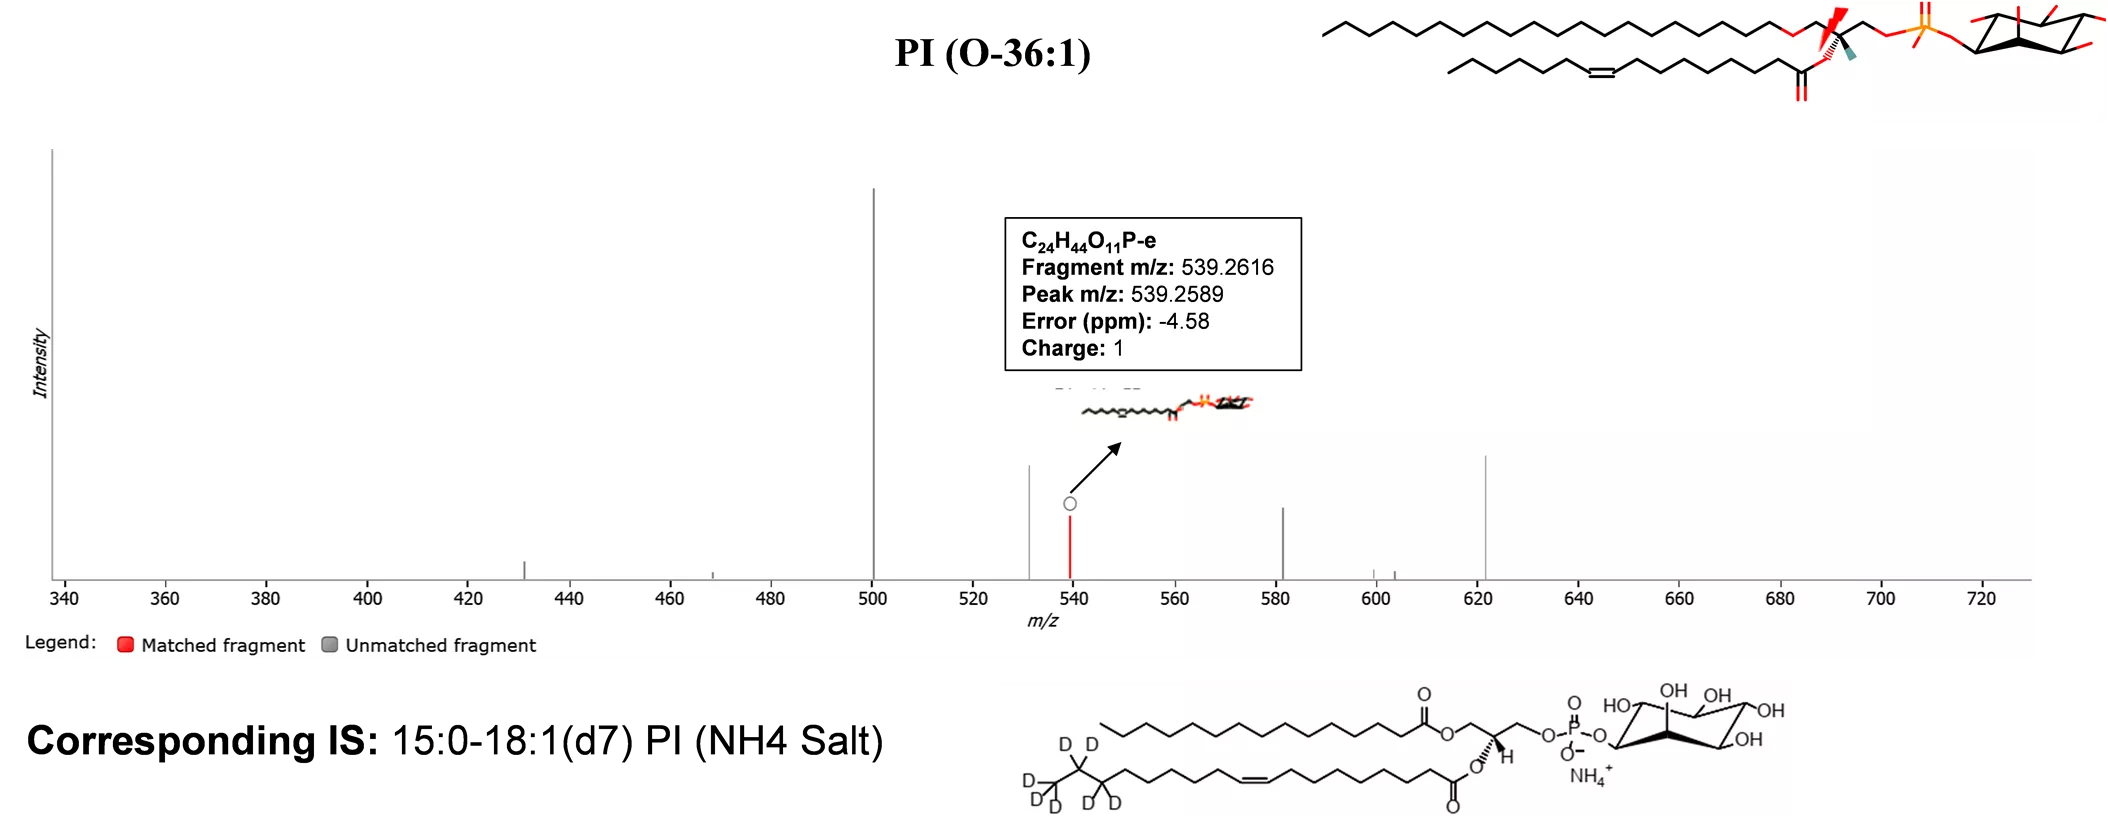

Figure S4. C. MS/MS spectrum of a precursor at m/z 890.6437 (ID: 1.73_890.6437m/z, RT=1.73 min) in positive mode with
adducts [M+H-H2O]
+
. The MS/MS spectrum was generated from MS
E
raw data using Progenesis QI software. Fragments
indicate that it’s C24 (OH) Sulfatide. The lightning shape represents the site of bond breakage.
C
Figure S4. D. MS/MS spectrum of a precursor at m/z 714.5371 (ID: 1.85_714.5371m/z, RT=1.85 min) in positive mode with
adducts [M+Na]
+
. The MS/MS spectrum was generated from MS
E
raw data using Progenesis QI software. Fragments
indicate that it’s PE (O-33:0). The lightning shape represents the site of bond breakage.
D
Detailed mass spectrometry data for various lipid species including APS(34:0), PI(O-36:1), C24(OH) Sulfatide, and PE(O-33:0) is provided in positive mode with corresponding adducts and neutral changes. The MS/MS spectra reveal fragment ions and structural information for each lipid species, aiding in their identification and characterization. Lightning symbols indicate sites of bond breakage in the molecules, and corresponding IS values are listed. Images of the MS/MS spectra are included for visual reference.

Download Presentation

Please find below an Image/Link to download the presentation.
The content on the website is provided AS IS for your information and personal use only. It may not be sold, licensed, or shared on other websites without obtaining consent from the author.If you encounter any issues during the download, it is possible that the publisher has removed the file from their server.
You are allowed to download the files provided on this website for personal or commercial use, subject to the condition that they are used lawfully. All files are the property of their respective owners.
The content on the website is provided AS IS for your information and personal use only. It may not be sold, licensed, or shared on other websites without obtaining consent from the author.
E N D
Presentation Transcript
A PS(34:0) C14H27O2-e Fragment m/z: 227.2006 Peak m/z: 227.2014 Error (ppm): 3.58 Charge: 1 C29H52O10P-e Fragment m/z: 590.3215 Peak m/z: 590.3223 Error (ppm): 1.51 Charge: 1 Neutral change:-H C27H50O9P-e Fragment m/z: 550.3266 Peak m/z: 550.3310 Error (ppm): 8.03 Charge: 1 Neutral change:+H C40H75O10P+H-H2O Fragment m/z: 729.5065 Peak m/z: 729.5013 Error (ppm): -7.21 Charge: 1 Corresponding IS: 15:0-18:1(d7) PS (Na Salt) Figure S4. A. MS/MS spectrum of a precursor at m/z 746.5259 (ID: 0.97_746.5259m/z, RT=0.97 min) in positive mode with adducts [M+H-H2O]+. The MS/MS spectrum was generated from MSEraw data using Progenesis QI software. Fragments indicate that it s PS(34:0). The lightning shape represents the site of bond breakage.
B PI (O-36:1) C24H44O11P-e Fragment m/z: 539.2616 Peak m/z: 539.2589 Error (ppm): -4.58 Charge: 1 Corresponding IS: 15:0-18:1(d7) PI (NH4 Salt) Figure S4. B. MS/MS spectrum of a precursor at m/z 426.3049 (ID: 0.95_426.3049m/z, RT=0.95 min) in positive mode with adducts [M+2H]2+. The MS/MS spectrum was generated from MSEraw data using Progenesis QI software. Fragments indicate that it s PI (O-36:1). The lightning shape represents the site of bond breakage.
C C24 (OH) Sulfatide C24H41NO9S+H-H2O Fragment m/z: 503.2547 Peak m/z: 503.2558 Error (ppm): 2.20 Charge: 1 Neutral change: +H Corresponding IS: 15:0-18:1(d7) PI (NH4 Salt) Figure S4. C. MS/MS spectrum of a precursor at m/z 890.6437 (ID: 1.73_890.6437m/z, RT=1.73 min) in positive mode with adducts [M+H-H2O]+. The MS/MS spectrum was generated from MSEraw data using Progenesis QI software. Fragments indicate that it s C24 (OH) Sulfatide. The lightning shape represents the site of bond breakage.
D PE (O-33:0) C13H25O+Na Fragment m/z: 219.1719 Peak m/z: 219.1744 Error (ppm): 11.21 Charge: 1 Neutral change: -H Corresponding IS: 15:0-18:1(d7) PE Figure S4. D. MS/MS spectrum of a precursor at m/z 714.5371 (ID: 1.85_714.5371m/z, RT=1.85 min) in positive mode with adducts [M+Na]+. The MS/MS spectrum was generated from MSEraw data using Progenesis QI software. Fragments indicate that it s PE (O-33:0). The lightning shape represents the site of bond breakage.