Understanding Mass Spectroscopy and Magnetic Sector Design in MS
Introduction to Mass Spectroscopy (MS), key physics effects, magnetic sector MS design considerations, measuring mass/charge ratio, and using derived principles to scan a magnetic sector MS. Learn about the historical development of magnetic sector mass spectrometers and the first recorded MS spectra by Francis William Aston.
- Mass Spectroscopy
- Magnetic Sector Design
- Physics Effects
- Measurement Techniques
- Historical Development
Download Presentation

Please find below an Image/Link to download the presentation.
The content on the website is provided AS IS for your information and personal use only. It may not be sold, licensed, or shared on other websites without obtaining consent from the author. Download presentation by click this link. If you encounter any issues during the download, it is possible that the publisher has removed the file from their server.
E N D
Presentation Transcript
Were doing MS next !!
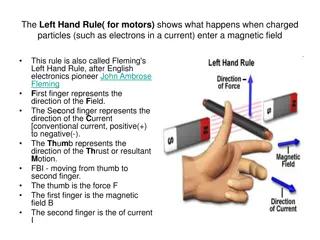
Introduction to Mass Spectroscopy (MS) Key physics effect Effect of charge flow direction on magnitude of Lorentz force, F `Lorentz Force (F) Effect (an example of the Right Hand rule for e-)* current For + species common in mass spec use left hand rule to decide direction of Lorentz force N S F
Magnetic sector MS design Variable effect on R (radius of turn) B up v up q up m up R ~ mv qB q v R down R up R down R up m B R Vary v with ion optics for fixed R, H and rearrange RB ~ m v q R
A tiny bit of physics-measuring m/q (mass/charge ratio) in magnetic sector instruments 1)Basic Electrical theory q= count of charge= 1,2,3 e=charge in coulombs on an electron (1.6E-19) V= energy/coulomb= voltage MS schematic Em = V(energy) * q*e (coulombs) (coulomb) 2)Basic mechanical theory v= particle velocity m = particle mass Em = mv2 3) Basic Magnetic effect r = radius of turn in magnetic field B= magnitude of the magnetic field r = m v= radius of turn qeB
Putting it all together 3) r = m v= radius of turn qeB 2) Em = mv2 + + Em = m (qeBr)2 m2 1) Em = V(energy) * q*e Em = m (qeBr)2 = V(energy) * q*e m2 m = 2V q B2r2 Reorganize to get m q
Using what weve derived to scan a magnetic sector MS m = 2V q B2r2 From Physics: From Experimental conditions: 1) B constant 2) Set detector to record only at fixed r m = constant *V q Vary accelerator voltage V to scan range of m/q
Magnetic Sector design (continued) Francis William Aston Cambridge University UK Nobel Prize in Chemistry 1922 The first sector mass spectrometer (Aston 1919)
First recorded ms spectra: Ne and Cl2 (Aston magnetic sector system) 20Ne 22Ne Exposed film strips Ne isotopes* * 10 protons + 10 or 12 neutrons Cl isotopes** m/q increasing 35Cl 37Cl 17 protons + 18 or 20 neutrons Why are there so many peaks for Ne and Cl which have only 2 isotopes ???? Aston s vacuum system was crude .air, water, CO2 and other contaminants are being detected
`old school MS of He Voltage scan of magnetic sector MS of He 1a)What are the mass of peaks at a,b,c &d (300, 1500, 3150 & 3300 volts ? 4*300=2 amu 600 20*1500=10 amu 3000 20*3150/3000 =21 amu 20*3300/3000= 22 amu 1b) What are the likely sources of these peaks? 4He2+ 20Ne2+ 21Ne+ 22Ne+
`old school MS of Ne Voltage scan of magnetic sector MS for Ne Based on the crudeness of Aston s vacuum, what are likely sources of masses at 16,17,18, 28 & 32 in Aston s first MS of `Ne ? 16 17 18 Your assignment?O+OH+ 28 32 N2+ O2+ H2O+
Modern Magnetic Sector Instrument student Sector MS-University of Wisconsin Department of Chemistry Inlet plumbing +source (North Carolina State instrument)
Holistic view: Magnetic Sector Instrument: University of Michigan Ann Arbor Chemistry Department
Typical Modern MS spectra Essence of pee (urea) cocaine Detector current (count) Mass/charge ratio (m/e)=(m/z)


