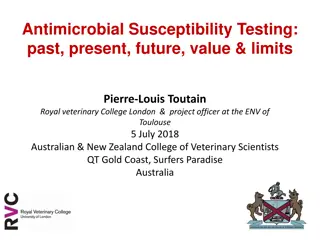
Optimised Live/Dead Fluorescence Spectrometry for Antimicrobial Susceptibility Testing
This study focuses on the optimisation of live/dead fluorescence spectrometry for rapid antimicrobial susceptibility testing. The research uses fluorescent dyes to distinguish between live and dead cells, providing a potential method for quick antimicrobial resistance diagnostics. The experiment involves control culture preparations, fluorescence measurements with specific equipment, and the comparison of live versus dead cells' fluorescence intensity. The findings suggest a potential application in combating antimicrobial resistance globally by enabling rapid and accurate assessment of bacterial viability.
- Fluorescence Spectrometry
- Antimicrobial Susceptibility Testing
- Live/Dead Cells
- Rapid Diagnostics
- Antibiotic Selection
Download Presentation

Please find below an Image/Link to download the presentation.
The content on the website is provided AS IS for your information and personal use only. It may not be sold, licensed, or shared on other websites without obtaining consent from the author. Download presentation by click this link. If you encounter any issues during the download, it is possible that the publisher has removed the file from their server.
E N D
Presentation Transcript
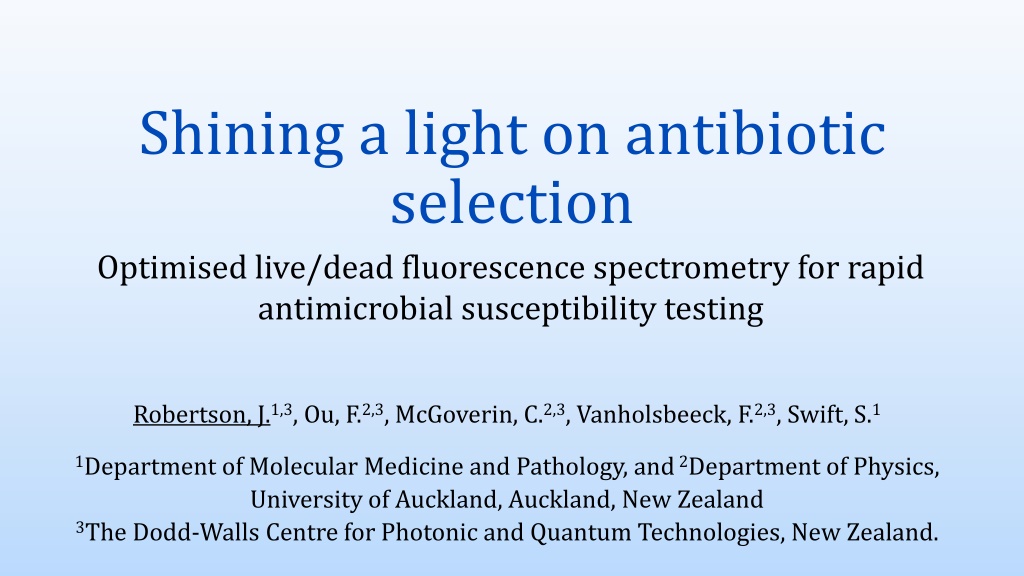
Shining a light on antibiotic selection Optimised live/dead fluorescence spectrometry for rapid antimicrobial susceptibility testing Robertson, J.1,3, Ou, F.2,3, McGoverin, C.2,3, Vanholsbeeck, F.2,3, Swift, S.1 1Department of Molecular Medicine and Pathology, and2Department of Physics, University of Auckland, Auckland, New Zealand 3The Dodd-Walls Centre for Photonic and Quantum Technologies, New Zealand.
Antimicrobial resistance WHO. Global Action Plan on Antimicrobial Resistance. Bull. World Health Organ. 10, 354 355 (2015). Sugden, R., Kelly, R. & Davies, S. Combatting antimicrobial resistance globally. Nat. Microbiol.1, (2016).
Rapid diagnostics using fluorescent dyes PI SYTO 9 Live Injured Dead: isopropanol Dead: lysed Fluorescence intensity (RFU) 40 30 20 10 0 450 500 550 Wavelength (nm) 600 650 700 750 Live cells Dead cells
Optimisation of live/dead spectrometry Minimal media R2: 0.9594 Saline R2: 0.5158 6 2 Proportion of live cells Proportion of live cells 4 1 Adjusted dye ratio (ADR) 2 0 0 0 20 40 60 80 100 0 20 40 60 80 100 Live and dead E. coli suspensions (% live) Live and dead E. coli suspensions (% live) Viable cell plate count (CFU/ml) Viable cell plate count (CFU/ml) 109 109 100 100 proportion of live cells proportion of live cells Adjusted dye ratio: Adjusted dye ratio: 80 80 108 108 60 60 40 40 107 107 20 20 106 106 0 0 0 1 2.5 5 10 25 50 75 90 95 97.5 99 100 0 10 25 50 75 90 95 97.5 99 100 Live and dead E. coli suspensions (% live) Adjusted dye ratio 1 2.5 5 Live and dead E. coli suspensions (% live) Adjusted dye ratio Viable cell plate count (CFU/ml) Viable cell plate count (CFU/ml)
Live and dead control Culture preparation Grown overnight Subcultured Dead cells (killed with 70 % isopropanol) Live & dead suspensions Control live Staining SYTO 9 stained cells PI SYTO 9 & PI stained cells stained cells
Live and dead control Fluorescence measurements DAQ card lasers 473 nm 532 nm photodiode 2x2 fibre coupler SYTO 9 stained cells shutter spectrometer PI 495 nm long pass filter stained cells computer Spectra SYTO 9 & PI stained cells Optrode Culture based measurements 20 l spread plates
Live cells vs dead cells Live cells Dead cells Fluorescence intensity (RFU) Fluorescence intensity (RFU) 200 200 SYTO 9 SYTO 9 150 150 PI PI 100 100 SYTO 9 & PI SYTO 9 & PI 50 50 50 50 40 40 30 30 20 20 10 10 0 0 450 500 550 600 650 700 750 Wavelength (nm) 450 500 550 600 650 700 750 Wavelength (nm) Dye interaction: Dye interaction: crosstalk quenching/enhancement & crosstalk SYTO 9 SYTO 9 & PI green emissions SYTO 9 > SYTO 9 & PI
Live/dead spectrometry Impact of quenching/enhancement 100 Red fluorescence intensity (RFU) Proportion of live cells (ADR) interaction on green emissions 1.0 104 100 % live 0.8 75 75 % live 0.6 50 % live 25 % live 0.4 50 0 % live 0.2 25 0.0 103 ADR Green Red
Escherichia coli ampicillin challenge Culture preparation Grown overnight Subcultured Unchallenged (live) cells Ampicillin challenged cells Staining SYTO 9 stained cells PI SYTO 9 & PI stained cells stained cells
E. coli ampicillin challenge Fluorescence measurements DAQ card lasers 473 nm 532 nm photodiode 2x2 fibre coupler SYTO 9 stained cells shutter spectrometer PI 495 nm long pass filter stained cells computer Spectra SYTO 9 & PI stained cells Optrode Culture based measurements 20 l spreads
E. coli ampicillin challenge Red fluorescence intensity (RFU) Impact of quenching/enhancement 100 105 1010 Proportion of live cells (ADR) * * * interaction on green emissions 1.0 * * * 109 0.8 108 75 107 CFU/ml 0.6 104 106 105 0.4 50 104 0.2 103 25 102 103 0.0 0 0.5 Time (h) 2 5 0 0.5 Time (h) 2 5 0 0.5 Time (h) 2 5 1 MBC amp: ADR Untr: ADR 1 MBC amp: CFU/ml Untr: CFU/ml 1 MBC amp: S - SP Untr: S - SP * 1 MBC amp: PI Untr: PI Amp = ampicillin treated; Untr = untreated MBC = minimum concentration that kills in 24 h Dotted/dashed lines represents the value derived from 100 % dead cells
Effect of antibiotic concentration Impact of quenching/enhancement * Red fluorescence intensity (RFU) * * interaction on green emissions 100 1.0 1010 105 Proportion of live cells (ADR) * * * * 109 0.8 108 75 107 0.6 CFU/ml 104 106 0.4 105 50 104 0.2 103 0.0 103 25 102 0 0.5 Time (h) 2 5 0 0.5 Time (h) 2 5 0 0.5 Time (h) 2 5 0.2 MBC amp: PI 2 MBC amp: PI Untr: PI 0.2 MBC amp: ADR 2 MBC amp: ADR Untr: ADR 0.2 MBC amp: CFU/ml 2 MBC amp: CFU/ml 0.2 MBC amp: S - SP * * * 2 MBC amp: S - SP Untr: CFU/ml Untr: S - SP Amp = ampicillin treated; Untr = untreated MBC = minimum concentration that kills in 24 h Dotted/dashed lines represents the value derived from 100 % dead cells
Effect of bacterial growth phase Impact of quenching/enhancement Red fluorescence intensity (RFU) * * * * * * * * * interaction on green emissions 100 105 1010 1.0 Proportion of live cells (ADR) 109 0.8 108 75 107 0.6 CFU/ml 104 106 0.4 105 50 104 0.2 103 25 103 102 0.0 0 0.5 Time (h) 2 5 0 0.5 Time (h) 2 5 0 0.5 Time (h) 2 5 Exp, amp: ADR Exp, amp: CFU/ml Exp, amp: PI Exp, untr: PI Stat, untr: PI Exp, amp: S - SP Exp, untr: S - SP * * * Stat, amp: ADR Exp, untr: ADR Stat, amp: CFU/ml Stat, amp: PI Stat, amp: S - SP Stat, untr: S - SP Exp, untr: CFU/ml Stat, untr: ADR Stat, untr: CFU/ml Amp = ampicillin treated; Untr = untreated Exp = exponential phase; Stat = stationary phase Dotted/dashed lines represents the value derived from 100 % dead cells
Conclusion Reliable determination of antibiotic susceptibility Bacterial growth phase Antibiotic concentration Treatment time + + Proportion of live cells (ADR) 100 1010 * * * 109 108 75 107 CFU/ml We can detect the killing of E. coli by ampicillin using live/dead spectrometry when optimised experimental parameters are used. 106 105 50 104 103 25 102 0 0.5 Time (h) 2 5 1 MBC amp: ADR Untr: ADR 1 MBC amp: CFU/ml Untr: CFU/ml *
Whats next? Ganewatta, M. S., Rahman, M. A. & Tang, C. Emerging Antimicrobial Research against Superbugs: Perspectives from a Polymer Laboratory. 15, (2017).
Acknowledgements Simon Swift Frederique Vanholsbeeck Cushla McGoverin We are grateful to the University of Auckland Faculty Research Development Fund award (3714262) for postdoctoral funding and the Ministry of Business, Innovation and Employment for funding the Food Safe (UOAX1411) research programme.
