Comprehensive Analysis of MS Qual/Quant QC Mix for Platform Characteristics Assessment
The MS Qual/Quant QC Mix (Sigma Aldrich) is designed for daily use in evaluating platform characteristics such as repeatability, system stability, and inter-/intra-platform comparisons. The content includes XIC analysis for peptides, a detailed table showing the difference in peak ratios, and correlation curves comparing theoretical ratios with standard ratios. These analytical tools provide valuable insights for improving analytical processes and ensuring data accuracy in mass spectrometry.

Download Presentation

Please find below an Image/Link to download the presentation.
The content on the website is provided AS IS for your information and personal use only. It may not be sold, licensed, or shared on other websites without obtaining consent from the author. Download presentation by click this link. If you encounter any issues during the download, it is possible that the publisher has removed the file from their server.
E N D
Presentation Transcript
MSQC1, MS Qual/Quant QC Mix
MS Qual/Quant QC Mix (Sigma- Aldrich) is intended for daily use to assess platform characteristics, including: Repeatability System stability (drift, chromatography, signal intensity, sensitivity, etc.) Inter- and intra-platform and lab comparisons
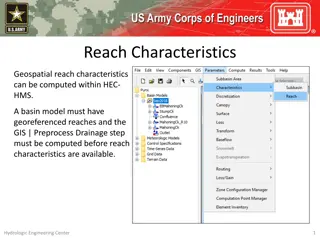
XIC for 3 peptides with their havey versions (MSQC1 standard QC from sigma)
XIC for 3 peptides with their havey versions (MSQC1 standard QC from sigma)
XIC for 5 peptides with their havey versions (MSQC1 standard QC from sigma)
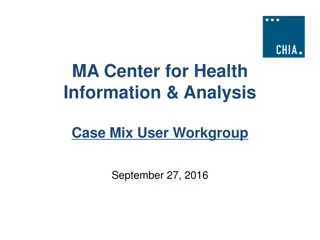
Table 2. shows the difference between RatioToStandard Vs Theoretical ratios. (Results Report, from Skyline) Peptide Sequence PeptidePeakFoundRatio RatioToStandard (L/H) Theoretical ratio 2 VLDALQAIK 1 2.0789 1 GGPFSDSYR 1 0.9873 50 SADFTNFDPR 0.67 34.6957 10 AVQQPDGLAVLGIFLK 0.67 5.2727 1 ALIVLAHSER 0.67 0.7895 2 EGHLSPDIVAEQK 1 1.2599 50 GYSIFSYATK 1 29.5 10 ESDTSYVSLK 0.83 7.3286 0.5 FEDENFILK 1 0.2171 1 VSFELFADK 0.83 0.4646 50 NLSVEDAAR 0.67 13.6667 10 FSTVAGESGSADTVR 0.5 2.5
Correlations curve between theoretical Vs Ratio toStandard Run, with R=0.8179 70 60 R = 0.8179 50 40 30 20 10 0 0 10 20 30 40 50 60 70 Theoretical Ratio
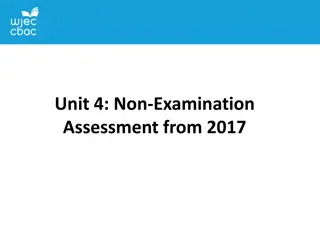
Table 2. shows the difference between RatioToStandard Vs Theoretical ratios. (Results Report, from Skyline) Peptide Sequence PeptidePeakFoundRatio RatioToStandard (L/H) Theoretical ratio 2 VLDALQAIK 1 2.0789 1 GGPFSDSYR 1 0.9873 50 SADFTNFDPR 0.67 34.6957 10 AVQQPDGLAVLGIFLK 0.67 5.2727 1 ALIVLAHSER 0.67 0.7895 2 EGHLSPDIVAEQK 1 1.2599 50 GYSIFSYATK 1 29.5 10 ESDTSYVSLK 0.83 7.3286 0.5 FEDENFILK 1 0.2171 1 VSFELFADK 0.83 0.4646 10 FSTVAGESGSADTVR 0.5 2.5
Correlations curve between theoretical Vs Ratio toStandard Run, with R=0.9796 60 R = 0.9796 50 Ratio toStandard Run 40 30 20 10 0 0 5 10 15 20 25 30 35 40 Theoretical Ratio
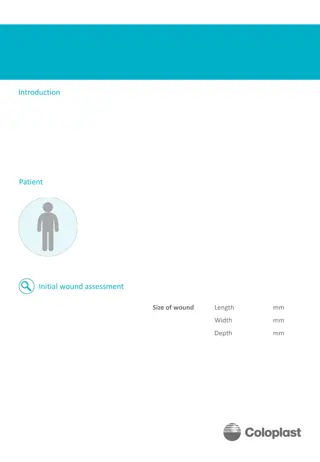
Sensitivity comparison between 4000 Vs 5500 Qtrap for NLSVEDAAR peptide. Peak area is 5 times higher in 5500 QTRAP 5500 4000
Sensitivity comparison between 4000 Vs 5500 Qtrap for NLSVEDAAR peptide. Peak area is 5 times higher in 5500 QTRAP 5500 4000

 is intended for daily")