Introduction to Computer Graphics: Overview and Importance
Computer Graphics (CG) involves creating and manipulating images using computers in both 2D and 3D space. This field is crucial in various industries such as science, engineering, medicine, entertainment, and more. CG is utilized for tasks like creating complex diagrams, architectural designs, flight simulations, and more. Interactive Computer Graphics (ICG) facilitates two-way communication between computers and users, enhancing training, design processes, and data visualization. The speed and efficiency of CG play a significant role in information absorption and task simplification across different domains.

Download Presentation

Please find below an Image/Link to download the presentation.
The content on the website is provided AS IS for your information and personal use only. It may not be sold, licensed, or shared on other websites without obtaining consent from the author. Download presentation by click this link. If you encounter any issues during the download, it is possible that the publisher has removed the file from their server.
E N D
Presentation Transcript
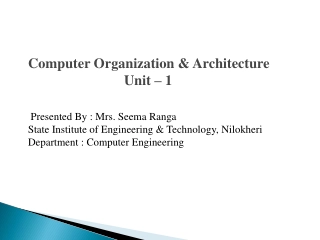
Anjuman College of Engineering and Technology Department of Computer Science & Engineering Fifth Semester Subject: COMPUTER GRAPHICS UNIT 1 : INTRODUCTION TO COMPUTER GRAPHICS Prepared By Prof. Sadia Patka Assistant Professor
OVERVIEW OF COMPUTER GRAPHICS (CG)
Definition and Importance of Computer Graphics The term computer graphics (CG) describes the use of computers to create and manipulate images. Graphics can be two- or three-dimensional Computer Graphics is the creation and manipulation of images or pictures with the help of computers. There are two types of computer graphics : 1) Passive Computer Graphics (Non-interactive Computer Graphics) 2) Active Computer Graphics (Interactive Computer Graphics)
Contd.. The major product of computer graphics is a picture. With the help of CG, pictures can be represented in 2D and 3D space. Many applications show various parts of the displayed picture changing in size and orientation. Such type of transformations i.e. the pictures can be made to grow, shrink, rotate and etc. can be achieved through CG. The display on them is often too big to be shown in their entirety. Thus, with the help of CG, a technique called clipping can be used to select just those parts of the picture that lie on the screen and to discard the rest.
Contd.. CG is in daily use in the field of science, engineering, medicine, entertainment, advertising, the graphic arts, the fine arts, business, education etc. The electronic industry is more dependent on the technologies provided by CG such as engineers can draw their circuit in a much shorter time, architects can have alternative solution to design problems, the molecular biologist can display pictures of molecules and can study on the structure, the town planners and transportation engineers use the computer generated maps which display data useful to them in their planning work etc.
Interactive Computer Graphics The Interactive computer graphics (ICG) provides two way communications between the computer and the user. The various applications of ICG are as follows. Using ICG system the integrated electronic circuits which are very complex can be drawn in a much shorter time. It is very useful in training of the pilots as they spend much of their training on the ground at the controls of a flight simulator and not in a real aircraft. There are many tasks that can be made easier & less expensive by the use of ICG. The effectiveness of the ICG is the speed with which the user can absorb the displayed information.
Contd.. The Interactive Graphics display consists of three major components as follows & shown in Figure 1: (1) Frame Buffer (2) T.V. Monitor (3)Display Controller Scan line Data 10001101 01101010 00101001 11100111 00111000 01010100 00111001 01010101 Display Adapter/ Display Controller Video Monitor/ T. V. Monitor Frame Buffer
Contd.. 1) Frame Buffer The images that are to be displayed are stored in a frame buffer in the form of matrix of intensity values. The frame buffer contains the image stored in binary form as a matrix of 0 s and 1 s which represent the pixel. 0 indicates the darkness and 1 indicates the image. The Frame Buffer holds the set of intensity values for all the screen points. The intensity values stored in a Frame Buffer are retrieved and painted on a screen one row at a time. This row is called as scan line. 2) Display Controller The Display Controller passes the contents of frame buffer to the T.V. Monitor. Display Controller reads successive bytes of data from the frame buffer & then converts 0 s and 1 s into the corresponding video signal. These signals are fed to the T.V. Monitor. 3) T.V. Monitor The T.V. Monitor then produces black and white pattern on the screen. The frame Buffer contents are to be modified, in order to represent the new pattern of pixels or if some changes are to be made on the displayed picture.
GRAPHICS AREAS The following major areas of computer graphics are: Modeling deals with the mathematical specification of shape and appearance properties in a way that can be stored on the computer. For example, a coffee mug might be described as a set of ordered 3D points along with some interpolation rule to connect the points and a reflection model that describes how light interacts with the mug. Rendering is a term inherited from art and deals with the creation of shaded images from 3D computer models. Animation is a technique to create an illusion of motion through sequences of images. Animation uses modeling and rendering but adds the key issue of movement over time, which is not usually dealt with in basic modeling and rendering.
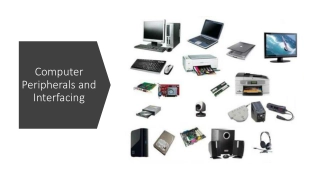
Contd.. There are many other areas that involve computer graphics. User interaction deals with the interface between input devices such as mice and tablets, the application, feedback to the user in imagery, and other sensory feedback. Virtual reality attempts to immerse the user into a 3D virtual world. This typically requires at least stereo graphics and response to head motion. For true virtual reality, sound and force feedback should be provided as well. Visualization attempts to give users insight into complex information via visual display. Image processing deals with the manipulation of 2D images and is used in both the fields of graphics and vision. 3D scanning uses range-finding technology to create measured 3D models. Such models are useful for creating rich visual imagery, and the processing of such models often requires graphics algorithms. Computational photography is the use of computer graphics, computer vision, and image processing methods to enable new ways of photographically capturing objects, scenes, and environments.
COMPUTER GRAPHICS APPLICATION Almost any field can make some use of computer graphics, but the major consumers of computer graphics technology include the following industries: Video games increasingly use sophisticated 3D models and rendering algorithms. Cartoons are often rendered directly from 3D models. Many traditional 2D cartoons use backgrounds rendered from 3D models, which allows a continuously moving viewpoint without huge amounts of artist time. Visual effects use almost all types of computer graphics technology. Almost every modern film uses digital compositing to superimpose backgrounds with separately filmed foregrounds. Many films also use 3D modeling and animation to create synthetic environments, objects, and even characters that most viewers will never suspect are not real. Animated films use many of the same techniques that are used for visual effects, but without necessarily aiming for images that look real. CAD/CAM stands for computer-aided design and computer-aided manufacturing. These fields use computer technology to design parts and products on the computer and then, using these virtual designs, to guide the manufacturing process. For example, many mechanical parts are designed in a 3D computer modeling package and then automatically produced on a computer-controlled milling device.
Contd.. Simulation can be thought of as accurate video gaming. For example, a flight simulator uses sophisticated 3D graphics to simulate the experience of flying an airplane. Such simulations can be extremely useful for initial training in safety-critical domains such as driving, and for scenario training for experienced users such as specific fire-fighting situations that are too costly or dangerous to create physically. Medical imaging creates meaningful images of scanned patient data. For example, a computed tomography (CT) dataset is composed of a large 3D rectangular array of density values. Computer graphics is used to create shaded images that help doctors extract the most salient information from such data. Information visualization creates images of data that do not necessarily have a natural visual depiction. For example, the temporal trend of the price of ten different stocks does not have an obvious visual depiction, but clever graphing techniques can help humans see the patterns in such data. Presentation graphics: In applications like summarizing of data of financial, statistical, mathematical, scientific and economic research reports, presentation graphics are used. It increases the understanding using visual tools like bar charts, line graphs, pie charts and other displays.
GRAPHICS PIPELINE In computer graphics, the graphics pipeline refers to a series of interconnected stages through which data and commands related to a scene go through during rendering process. It takes us from the mathematical description of an object to its representation on the device. The figure 2 shown below illustrates a 3D graphic pipeline. The real world objects are represented in world coordinate system. It is then projected onto a view plane. The projection is done from the viewpoint of the position of a camera or eye. There isan associated camera coordinate system whose z axis specifiesthe view direction when viewed from the viewpoint. The infinitevolume swept by the rays emerging from the viewpoint and passingthrough the window is called as view volume or view pyramid. Clipping planes (near and far) are used to limit the output of theobject.
Contd.. Figure 2: A 3D graphic pipeline
Contd.. The mapping of an object to a graphic device requires the transformation of view plane coordinates to physical device coordinates. There are two steps involved in this process. 1) The window to a viewport transformation. The viewport is basically a sub rectangle of a fixed rectangle known as logical screen. 2) The transformation of logical screen coordinates to physical device coordinates.
Contd.. Figure 3 (a): Sequence of transformation in viewing pipeline Figure 3 (b): 2D coordinate system to physical device coordinates transformation
Cathode Ray Tube (CRT) The most common graphics output device is the video monitor which is based on the standard cathode ray tube (CRT) design. Figure 4 illustrates the basic operation of a CRT. Figure 4: Cathode Ray Tube (CRT)
Contd.. As shown in above figure, it consists of electron gun, focusing system, deflection plates and a phosphor-coated screen. Electron gun is the primary component of a CRT. When the heat is supplied to the electron gun by directing a current, a beam of electrons emitted by an electron gun, passes through focusing and deflection systems that direct the beam toward specified positions on the phosphor-coated screen. The focusing system in a CRT is needed to force the electron beam to converge into a small spot as it strikes the phosphor. There are two pairs of deflection plates - Horizontal deflection plates and vertical deflectionplates. One pair of plates is mounted horizontally to control the vertical deflection, and the other pair is mounted vertically to control horizontal deflection.
Contd.. The beam passes between the two pairs of deflection plates and positioned on the screen. The phosphor then emits a small spot of light at each position contacted by the electron beam. Because the light emitted by the phosphor fades very rapidly, some method is needed for maintaining the screen picture. One Way to keep the phosphor glowing is to redraw the picture repeatedly by quickly directing the electron beam back over the same points. This type of display is called a refresh CRT. In CRT monitors there are two techniques of displaying images: 1) Raster scan displays 2) Random scan displays
Raster Scan Displays Figure 6: Horizontal and Vertical Retrace Figure 5: Raster Scan Display
Raster Scan Systems Figure 7: Architecture of a simple raster system
Contd.. Figure 8: Architecture of a raster system
Raster Scan Display Processor Figure 9 shows one way to set up the organization of a raster system containing a separate display processor, sometimes referred to as a graphics controller or a display coprocessor. Figure 9: Architecture of a raster-graphics system with a display processor
Random Scan Display/ Vector-Scan Display/ Calligraphic Displays Figure 10: Random Scan Display
Random-Scan Systems/ Random-Scan Display Processor Figure 11: Architecture of a simple random scan system
HARD COPY DEVICES Printers Plotters INPUT DEVICES FOR OPERATOR INTERACTION Keyboards Mouse Trackball and Spaceball Joysticks Data Glove Digitizers Touch Screens Light pen Voice Systems Image Scanners


")