Effective Tips for Designing Publications and Presentations
Enhance the quality of your publications and presentations with these insightful design tips focusing on graphics, images, text legibility, font choices, and more. Learn how to create visually appealing material that engages your audience effectively.

Download Presentation

Please find below an Image/Link to download the presentation.
The content on the website is provided AS IS for your information and personal use only. It may not be sold, licensed, or shared on other websites without obtaining consent from the author. Download presentation by click this link. If you encounter any issues during the download, it is possible that the publisher has removed the file from their server.
E N D
Presentation Transcript
Graphics and Images for Publication and Presentation Aaron D. Fuegi aarondf@bu.edu Scientific Computing and Visualization Information Services & Technology Boston University
Information Services & Technology 10/6/2024 Outline Design Tips Image Files Working with Applications Additional Resources
Information Services & Technology 10/6/2024 Design Tips PowerPoint Text Charts Legibility Accessibility
Information Services & Technology 10/6/2024 PowerPoint Tips High contrast background and text color. Not too much text on any slide. Standard, simple fonts. Minimum font sizes in general: 32 pt. for titles 24 pt. for header lines 16 pt. for other text 4
Information Services & Technology 10/6/2024 PowerPoint Tips (continued) Don t Use Too Many Levels Of Indentation Especially If Text Keeps Shrinking 5
Information Services & Technology 10/6/2024 Text in Slides or Publications DO NOT USE ALL CAPS. IT LOSES IMPACT IMMEDIATELY. Capitalizing a SINGLE word can be a reasonable alternative to bold or if the text is already BOLD. Italics can also be used for emphasis but it is harder to read. Italics reads more easily in print than on screen. Try to limit slides to 9 lines of text when possible. 6
Information Services & Technology 10/6/2024 Font Choice (all size 20 normal) Font Sample Text Arial The quick brown fox jumps over the lazy dog. Courier New The quick brown fox jumps over the lazy dog. Palatino Linotype Times New Roman The quick brown fox jumps over the lazy dog. The quick brown fox jumps over the lazy dog. Verdana The quick brown fox jumps over the lazy dog. 7
Information Services & Technology 10/6/2024 Font Size Arial (Normal & Bold) 8 abcdefghijklmnopqrstuvwxyz 8 abcdefghijklmnopqrstuvwxyz 10 abcdefghijklmnopqrstuvwxyz 10 abcdefghijklmnopqrstuvwxyz 12 abcdefghijklmnopqrstuvwxyz 12 abcdefghijklmnopqrstuvwxyz 14 abcdefghijklmnopqrstuvwxyz 14 abcdefghijklmnopqrstuvwxyz 18 abcdefghijklmnopqrstuvwxy 18 abcdefghijklmnopqrstuvwxy 24 abcdefghijklmnopqrst 24 abcdefghijklmnopqrst 30 abcdefghijklmno 30 abcdefghijklmno 36 abcdefghijklm 36 abcdefghijklm 8
Information Services & Technology 10/6/2024 Charts Tips Show important information clearly. Eliminate distractions such as unnecessary grid lines or fine scale marks. Use a line width of at least 1 point. Use contrasting colors and large, readable fonts for the legend and axis notations. 9
Information Services & Technology 10/6/2024 Charts - Use Strongly Contrasting Colors Boston 2010 Precipitation 4.0 Summer Fall 3.5 Winter 3.0 Spring Inches of Precipitation 2.5 2.0 1.5 1.0 0.5 0.0 Sunday Monday Tuesday Wednesday Day of Week Thursday Friday Saturday 10
Information Services & Technology 10/6/2024 Or Use One Exceptional Color for Emphasis Boston 2010 Precipitation - Fall Emphasized 4.0 Summer 3.5 Fall Winter 3.0 Inches of Precipitation Spring 2.5 2.0 1.5 1.0 0.5 0.0 Sunday Monday Tuesday Wednesday Day of Week Thursday Friday Saturday 11
Information Services & Technology 10/6/2024 Legibility Depends on the Contrast in Value 12
Information Services & Technology 10/6/2024 Accessibility Issues Color Blindness Use high contrast colors. Avoid using both Reds and Greens. Try to indicate differences with an additional means beyond color, such as different symbols or text. See http://safecolours.rigdenage.com/palettefiles.html for color palettes as experienced by the color blind. Low Vision Use particularly large fonts and, again, high contrast colors. 13
Information Services & Technology 10/6/2024 Image Files Raster Image Files Vector Image Files Printing Images Anti-aliasing
Information Services & Technology 10/6/2024 Image File Formats Raster tiff, png, bmp, jpg, gif Vector Portable Document Format - .pdf PowerPoint - .ppt Adobe Illustrator - .ai Photoshop - .psd PostScript - .ps Encapsulated PostScript - .eps Drawing and CAD packages 15
Information Services & Technology 10/6/2024 Raster Image Files Raster image files are composed of a grid of pixels. Each pixel contains color information Storing A Pixel s Color Information 24 bit full color (16.7 million colors) png, tiff, rgb, bmp, jpg Note: An alpha channel controlling transparency when present is also 8 bits so files with one are 32 bit files. 8 bit color map (256 colors) gif, tiff, rgb Bitmap (black and white only) tiff, bmp Compression Lossless (png, tiff, rgb) Lossy (jpg) 16
Information Services & Technology 10/6/2024 24 Bit Full Color Pixel Values (16.7 million possible colors) R G B R G B R G B 0 0 0 128 0 0 255 0 0 128 128 128 0 128 0 0 255 0 255 255 255 0 0 128 0 0 255 Web Equivalents (Hexadecimal RRGGBB) P3 3 3 255 0 0 0 128 0 0 255 0 0 128 128 128 0 128 0 0 255 0 255 255 255 0 0 128 0 0 255 24 bit 3x3 Pixel PPM File 000000 800000 FF0000 808080 008000 00FF00 FFFFFF 000080 0000FF 17
Information Services & Technology 10/6/2024 8 Bit Color Map - aka Indexed (256 possible colors) - Many packages give you tools for editing the color map Index # R G B Black Red Yellow Green Cyan Blue Magenta Dk red Dk green Dk blue 0 0 0 0 1 255 2 255 255 3 0 255 0 4 0 255 255 5 0 0 255 6 255 0 255 7 128 0 0 8 0 128 0 9 0 0 128 . 250 128 128 128 . 255 255 255 255 0 0 0 0 7 1 250 8 3 255 9 5 Gray White 18
Information Services & Technology 10/6/2024 Raster Image Quality There are several ways to affect image quality Resolution/Number of Pixels/DPI Number of available colors Anti-aliasing Compression 19
Information Services & Technology 10/6/2024 Vector Image Files PostScript Example The PostScript code on the left results in the image below. %! 0 setlinewidth /Times-Roman findfont 12 scalefont setfont 0.0 setgray 0.000 setgray newpath 0 0 moveto 374 328 moveto 323 332 lineto 240 330 lineto 287 326 lineto 374 328 lineto 306 427 moveto 287 326 lineto 240 330 lineto 306 427 lineto 306 427 moveto 240 330 lineto 323 332 lineto 306 427 lineto 306 427 moveto 323 332 lineto 374 328 lineto 306 427 lineto 306 427 moveto 374 328 lineto 287 326 lineto 306 427 lineto 0 setlinewidth stroke showpage 20
Information Services & Technology 10/6/2024 Vector Image Files Many packages create their own proprietary formats. Vector files are usually resolution independent. Thus, they can be easily printed at different resolutions. Line thickness may be an issue. Converting to raster image format should be done with care and only as a last step when necessary. The transformation to a raster image is completely nonreversible. Use anti-aliasing if possible when doing the conversion. 21
Information Services & Technology 10/6/2024 Printing Images RGB vs. CMYK Color Model Computer Monitors RGB Color Additive color model The default color is Black and the more Red, Green, and Blue light projected, the closer you get to White. Printers CMYK Color Subtractive color model The default color is White, and your objective in printing is to block out color/intensity by printing Cyan, Magenta, Yellow (and Black) ink. You get Black when you use the greatest amount of ink. 22
Information Services & Technology 10/6/2024 Printing Images (continued) These two models, additive and subtractive color, are opposites and it is not possible to directly translate from one to the other. Printers (and the conversion software they use) nowadays do a very good job however of approximating this translation. See http://en.wikipedia.org/wiki/CMYK_color_model for more details 23
Information Services & Technology 10/6/2024 Publications Requirements Read carefully and provide them what they want. Comments DPI (dots per inch) Only means anything when a size is given. If no size is given, assume a fairly large size such as 8 x10 . At 300 DPI an 8 x10 image needs to be 2400x3000 pixels. Format Commonly requested formats are Tiff, High Quality Jpeg, RAW (digital camera format does not apply to computer generated imagery). 24
Information Services & Technology 10/6/2024 Screen Capture From Linux: import file.ext lets you select the area you wish to capture. The import command has lots of options, type import help From a Windows PC: Full screen press the Print Screen key and the image will be copied to the clipboard. Press Ctrl v to paste it. Single window - highlight the window, press the Alt key and the Print Screen key. Press Ctrl v to paste it. Use a graphics card that has hardware antialiasing and be sure to enable it before doing a screen capture. 25
Information Services & Technology 10/6/2024 Aliasing and Anti-aliasing Aliased and Anti-aliased Text Aliased and Anti-aliased Checkerboard Pattern 26
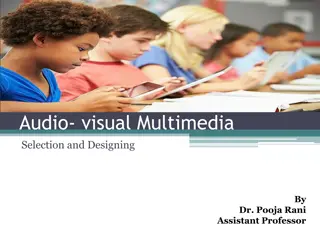
Information Services & Technology 10/6/2024 Working With Applications MATLAB Adobe Photoshop Microsoft Excel
Information Services & Technology 10/6/2024 High Resolution MATLAB Output Original MATLAB code section (this is just the section related to the appearance and printing of the plot): colormap('jet'); axis([ -.6 1 0 .125]); shading interp axis equal; % place the print command here to print each figure printfile = ['test','.tiff'] print('-dtiff',printfile) generates the 1200x900 pixel image on the right above: 28
Information Services & Technology 10/6/2024 We wanted to generate the image at a higher resolution, without the axes, without any white space on the left and right, and with only a small amount of white space above and below. colormap(jet(256)); % Increases colormap to a full 256 entries from default. Recommended you ALWAYS do this for all colormaps. axis([ -.6 1 0 .125]); shading interp axis image; % Condenses figure around displayed material and sets the aspect ratio so that the data units are the same in both % directions. axis off % suppress axis display set(gcf,'Renderer','Zbuffer') % Use software renderer only. Default 'opengl' renderer takes advantage of graphics hardware on % local machine. This can be good but also can result in exceeding the capacity of the graphics card at high resolutions leading % to corrupted images. set(gcf,'color','white') % Change figure background color to white set(gca, 'Position', [0 0 1 1]); myfiguresize = [0 0 8.0 2.0] % Set figure size. This results in a 8x2 inch(default unit) image. Combined with the -r#### DPI % resolution in the print command below, this controls the size of the output image in pixels. set(gcf,'PaperPosition',myfiguresize); mypos = get(gcf,'Position'); mypos(3) = mypos(4); set(gcf,'Position',mypos); % In combination, applies the size and position set above. % place the print command here to print each figure printfile = ['test','.tiff'] print('-dtiff','-r1024',printfile) % Prints to a tiff output image at 1024 DPI. With the 8x2 inch settings above this results in an 8192 % (1024 x 8) by 2048 (1024 x 2) tiff image file. This generates the new very large 8192x2048 pixel image: 29
Information Services & Technology 10/6/2024 Note on MATLAB It is also important to note that many of the changes in the previous slide have no effect on the figure shown on screen and only affect the output image file. The only changes that do show up in the MATLAB figure display result from the axis off and axis image commands in the second code section on the previous slide. Antialiasing in MATLAB: http://www.mathworks.com/matlabcentral/fileexchange /20979-myaa-my-anti-alias-for-matlab 30
Information Services & Technology 10/6/2024 Photoshop Tips Image -> Image Size Rescale the image up or down Image -> Canvas Size Crop or Expand (such as add a blue border around the edge of) the Image Area Things to Consider Units choose appropriate units. For Image Size, algorithm used to adjust. For Canvas Size, positioning of current image within the new image canvas: centered, on left edge, ... 31
Information Services & Technology 10/6/2024 Photoshop Tips Continued Layer -> Flatten Image Eliminates layers and prepares to save as a raster image. Only to be done at end of process and do not delete the original layered Photoshop file. Do a Save as to a new name after you flatten the image. Image -> Mode Should be set appropriately to the image file format you plan to save to. RGB Color, 8 Bits/Channel, is what you will usually want. However, if you want to save a GIF file, you should set the Mode to Indexed Color. The above is no longer required for Photoshop. It will do the mode conversion automatically on a Save As 32
Information Services & Technology 10/6/2024 Microsoft Excel Tips Microsoft Excel Plots are manipulated by selecting elements of the plot with the Mouse and then right- clicking and generally choosing Format Element ; this can also generally be done through the Chart Tools -> Layout toolbar. Precise control over plot size is very tricky given this. You can set the whole Chart Area to be a specific size but Excel adapts the smaller elements somewhat as it sees fit. If you need a plot of a particular size in another application, trial and error is often necessary. 33
Information Services & Technology 10/6/2024 Additional Materials to Explore Edward Tufte, The Visual Display of Quantitative Information , etc http://www.edwardtufte.com/tufte/books_vdqi Maureen Stone, Choosing Colors for Data Visualization http://www.perceptualedge.com/articles/b- eye/choosing_colors.pdf Jiro Doke, Making Pretty Graphs in MATLAB http://blogs.mathworks.com/loren/2007/12/11/making-pretty- graphs/ Introduction to Image Files Tutorial http://www.bu.edu/tech/research/training/tutorials/imagefiles/ 34
Information Services & Technology 10/6/2024 Tutorial Survey Please open a web browser and go to: http://scv.bu.edu/survey/tutorial_evaluation.html to fill out the tutorial survey. Thanks for coming. Tutorials slides available on the web from: http://www.bu.edu/tech/research/training/tutorials/list/ 35