Analyzing Residual Plots for Regression Model Appropriateness in Golf
Utilizing residual plots to evaluate the appropriateness of a linear regression model predicting scoring average from average driving distance in golf based on LPGA data. Introduction to quadratic and exponential models, with an example exploring the relationship between braking distance for motorcycles and speed at brake application. Step-by-step guidance on calculating quadratic models, interpreting residuals, and sketching scatterplots. Leveraging technology to determine the most suitable model for curved relationships in statistical analysis.

Download Presentation

Please find below an Image/Link to download the presentation.
The content on the website is provided AS IS for your information and personal use only. It may not be sold, licensed, or shared on other websites without obtaining consent from the author. Download presentation by click this link. If you encounter any issues during the download, it is possible that the publisher has removed the file from their server.
E N D
Presentation Transcript
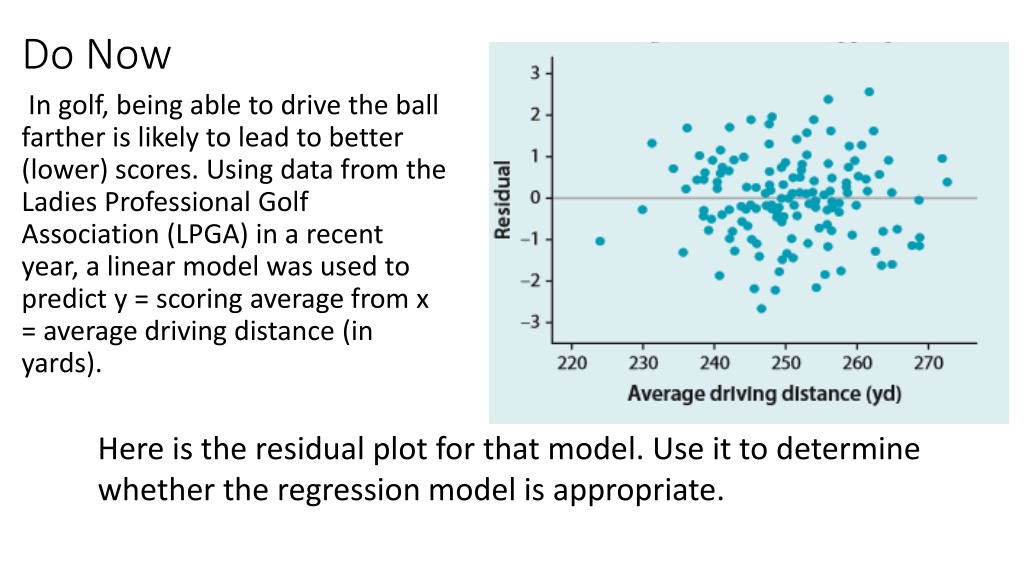
Do Now In golf, being able to drive the ball farther is likely to lead to better (lower) scores. Using data from the Ladies Professional Golf Association (LPGA) in a recent year, a linear model was used to predict y = scoring average from x = average driving distance (in yards). Here is the residual plot for that model. Use it to determine whether the regression model is appropriate.
Lesson 2.8 Fitting Models to Curved Relationships
Objectives Use technology to calculate quadratic models for curved relationships, then calculate and interpret residuals using the model. Use technology to calculate exponential models for curved relationships, then calculate and interpret residuals using the model. Use residual plots to determine the most appropriate model.
Quadratic Models In some cases, we can use a quadratic model to fit a nonlinear association between two quantitative variables. A quadratic model is a model in the form ? = ax2+ bx + c.The graph of a quadratic model is a parabola
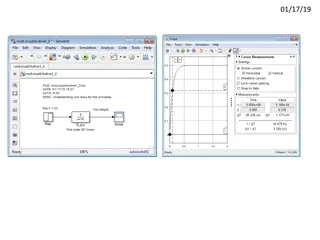
You try! How is the braking distance for a motorcycle related to the speed the motorcycle was going when the brake was applied? Statistics teacher Aaron Waggoner gathered data to answer this question. The table shows the speed (in miles per hour) and the distance needed to come to a complete stop when the brake was applied (in feet).
a) Calculate a quadratic model for these data using speed as the explanatory variable. b) Sketch the scatterplot, along with the quadratic model. c) Calculate and interpret the residual for the last observation in the table.
Solution a) The quadratic model is ? = 0.043x2+ 0.33x 2.294 b) Here is the scatterplot, along with the quadratic model from the applet. The braking distance for this trial was 2.27 feet less than expected, based on the quadratic model with x = speed.
Exponential Models We can also use an exponential model to fit a nonlinear association between two quantitative variables. An exponential model is a model in the form ? = ? ??, where b > 0. If b > 1, the graph will show exponential growth. If 0 < b < 1, the graph will show exponential decay.
You Try! A random sample of 14 golfers was selected from the 147 players on the Ladies Professional golf Association (LPgA) tour in a recent year. The total amount of money won during the year (in dollars) and the average number of strokes above 70 for each player in the sample were recorded. Lower scoring averages are better in golf.
a) Calculate an exponential model for these data using adjusted scoring average as the explanatory variable. Sketch the scatterplot, along with the exponential model. Calculate and interpret the residual for Lorena Ochoa, the last golfer in the list. b) c)
Solution a) Using the Two Quantitative Variables applet, the exponential model is b) Here is the scatterplot, along with the exponential model c) The earnings for Lorena Ochoa were $345,839 greater than expected, based on the exponential model with x 5 adjusted scoring average.
Choosing a Model In some cases, it is hard to tell if a quadratic model or an exponential model would be better to use. To decide, look at the residual plots for both models and choose the model with the residual plot that has the most random scatter.
Example In Lesson 2.7, we looked at the relationship between the cost of a 30-second commercial during the Super Bowl and the Super Bowl number. The scatterplot to the right clearly shows that the relationship is nonlinear. An exponential model and a quadratic model were calculated for the relationship between cost and Super Bowl number. Here are the residual plots for these models. Based on the residual plots, which model is more appropriate? Explain.
Solution Because the residual plot for the quadratic model seems more randomly scattered, the quadratic model is more appropriate for these data than the exponential model.


 Calculate a quadratic")


")