Land Mass Change Along the Bangladesh Coastline Study
The study examines land mass changes along the vulnerable Bangladesh coastline due to climate change impacts. Data from 1973 to 2015 shows erosion and accretion rates in different districts, highlighting the dynamic nature of the coastal region. GIS technology is utilized to analyze and visualize the shifts in land mass over time.

Download Presentation

Please find below an Image/Link to download the presentation.
The content on the website is provided AS IS for your information and personal use only. It may not be sold, licensed, or shared on other websites without obtaining consent from the author. Download presentation by click this link. If you encounter any issues during the download, it is possible that the publisher has removed the file from their server.
E N D
Presentation Transcript
Land Mass Change Along the Bangladesh Coastline Manar Hasan GIS in Water Resources, University of Texas at Austin December 1, 2016
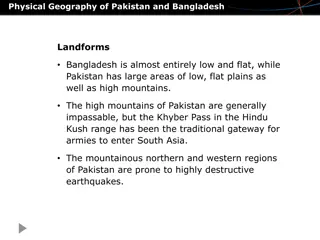
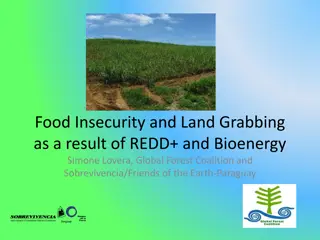
Background The National Geographic Society finds that Bangladesh is in an area that is most vulnerableto the impacts of climate change. The reasons for this are complex. Low-lying coastal region. Surrounded by boundary rivers. Deadly floods are a common yearly occurrence. How much is the land mass actually changing?
Background The National Geographic Society finds that Bangladesh is in an area that is most vulnerableto the impacts of climate change. The reasons for this are complex. Low-lying coastal region. Surrounded by boundary rivers. Deadly floods are a common yearly occurrence. How much is the land mass actually changing?
Background The National Geographic Society finds that Bangladesh is in an area that is most vulnerableto the impacts of climate change. The reasons for this are complex. Low-lying coastal region. Surrounded by boundary rivers. Deadly floods are a common yearly occurrence. How much is the land mass actually changing?
Methodology Erosion-Accretion data obtained from the Center for Environmental and Geographic Information Services 1973 to 2015 Data tabulated and ArcGIS used to calculated net rates ArcGIS map shape subtractions/additions to show overall land mass change
For 1973 to 1984 Net Accretion (km2) 1 -29 Accretion (km2) 25 160 Erosion (km2) 24 189 District Barguna Bhola Net Accretion/Time Accretion - Erosion Accretion (km2) 12 25 132 160 16 85 85 12 4 43 242 89 12 20 936 Erosion (km2) 12 24 88 189 53 47 2 5 6 72 104 178 3 7 790 Net Accretion (km2) 0 1 44 -29 -37 38 82 7 -2 -29 138 -89 9 13 147 Accretion rate (km2/yr) 0 0.1 4 -2.7 -3.4 3.5 7.5 0.7 -0.2 -2.6 12.6 -8.1 0.8 1.2 13.3 District Bagerhat Barguna Barisal Bhola Chandpur Chittagong Cox's Bazar Feni Jhalokati Lakshmipur Noakhali Patuakhali Pirojpur Shariatpur Accretion rate (km2/yr) 0.1 -2.7 For all districts over time
1973 to 1984 2006 to 2015 Net Accretion (km2) Accretion rate (km2/yr) 0 1 44 -29 -37 38 82 7 -2 -29 138 -89 9 13 147 Net Accretion (km2) Accretion rate (km2/yr) -3 -13 -5 -17 23 46 15 -3 -2 -56 162 -24 -5 12 130 District Bagerhat Barguna Barisal Bhola Chandpur Chittagong Cox's Bazar Feni Jhalokati Lakshmipur Noakhali Patuakhali Pirojpur Shariatpur District Bagerhat Barguna Barisal Bhola Chandpur Chittagong Cox's Bazar Feni Jhalokati Lakshmipur Noakhali Patuakhali Pirojpur Shariatpur 0 -0.3 -1.4 -0.5 -1.8 2.6 5.1 1.7 -0.4 -0.2 -6.3 18 -2.7 -0.5 1.3 14.4 0.1 4 -2.7 -3.4 3.5 7.5 0.7 -0.2 -2.6 12.6 -8.1 0.8 1.2 13.3 Between 1973 and 1984 Between 2006 and 2015
Net Accretion in Districts East of Meghna River 200 162 150 138 100 93 NET ACRETION (KM^2) 84 82 60 50 46 38 32 23 15 14 13 14 3 7 0 -3 -5 1973 to 1984 1984 to 1996 1996 to 2006 2006 to 2015 -12 -26 -29 -37 -41 -50 -56 -100 TIMELINE
Net Accretion in Districts West of Meghna River 250 200 150 NET ACCRETION (KM^2) 100 50 0 1973 to 1984 1984 to 1996 1996 to 2006 2006 to 2015 -50 -100 -150 TIMELINE
Net Accretion Along Coastal Districts 250 200 150 100 NET ACCRETION (KM^2) 50 0 1973 to 1984 1984 to 1996 1996 to 2006 2006 to 2015 -50 -100 -150 TIMELINE
Between 1973 and 1984 Between 2006 and 2015
Preliminary Findings Land increasing overall Accretion towards Eastern side of the coast. Erosion mostly on Western coast.
Further Investigation Instead of just looking at where mass increased or decreased, postulate why it happened? Compare data available with major weather events in the area (floods, hurricanes, Himalayan ice melts) to see if patterns exist. Look at population/land cover in net erosion areas to determine negative impacts on food/population security.