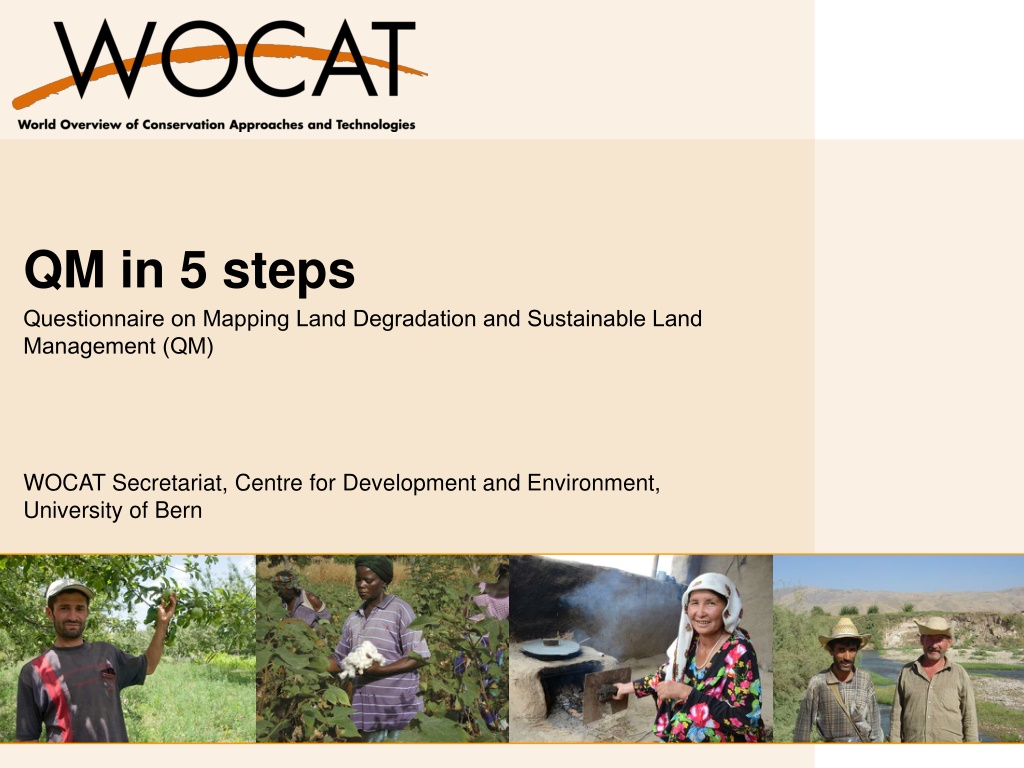
5 Steps Questionnaire on Mapping Land Degradation and Sustainable Land Management
Preparation for mapping land degradation and sustainable land management involves steps such as preparing the base map, identifying contributing specialists, assessing land use systems, understanding land degradation types, and providing expert recommendations. The process includes analyzing area trends, intensity changes, direct and indirect causes of land degradation, and making recommendations for sustainable land management practices.

Download Presentation

Please find below an Image/Link to download the presentation.
The content on the website is provided AS IS for your information and personal use only. It may not be sold, licensed, or shared on other websites without obtaining consent from the author. Download presentation by click this link. If you encounter any issues during the download, it is possible that the publisher has removed the file from their server.
E N D
Presentation Transcript
QM in 5 steps Questionnaire on Mapping Land Degradation and Sustainable Land Management (QM) WOCAT Secretariat, Centre for Development and Environment, University of Bern
5 Steps Preparation of the base map Step 1: Contributing specialists Step 2: Land Use System (FAO) Step 3: Land degradation Step 4: Sustainable Land Management Step 5: Expert recommendation
Preparation: Base map with mapping units Mapping unit: each land use system within an administrative unit Where no LUS map is available or not at the appropriate scale for a study site, any other land use/land cover map can be used as a base map. The smaller is the administrative unit, the more detailed the map will be. 4
Step 1: Contributing specialists Team of specialists (related to land degradation, land management, land use and soil and water conservation in the country.) Participatory expert assessment (supported by documents) Photos: H.P. Liniger 5
Step 2: Land Use System (FAO) Estimation of the increase or decrease in area over the past 10 years Estimation of the increase or decrease of the intensity of each LUS Land Use System (LUS) Type Area trend Intensity trend Area trend 2 = area coverage is rapidly increasing in size; i.e. > 10% of the LUS area/10 years Intensity trend 1 = Moderate increase 6
3 3 Area trend 7
Step 3: Land degradation Determine the major types of land degradation presently occurring under each land use system Degradation per LUS Type Extent (area) Degree Rate (Impact on ecosystem services (type and level)) Direct causes Indirect causes Recommendation
Land degradation types Vegetation degradation Salinization Soil compaction : Detrimental effects of fires Soil erosion by wind G. Schwilch HP. Liniger G. Schwilch HP. Liniger G. Schwilch
Land Degradation types (1) Land Degradation types (1) (WOCAT 2008) W: Soil erosion by water E: Soil erosion by wind C: Chemical soil deterioration P: Physical soil deterioration B: Biological degradation H: Water degradation
Land Degradation types (1) Land Degradation types (1) (WOCAT 2008) W: Soil erosion by water Wt loss of topsoil (surface erosion) Wg gullying (gully erosion) Wm mass movements Wr riverbank erosion Wc coastal erosion Wo offsite degradation E: Soil erosion by wind Et loss of topsoil Ed deflation and deposition Eo offsite effects C: Chemical soil deterioration Cn fertility decline and reduced organic matter content Ca acidification Cp soil pollution Cs salinisation/alkalinisation P: Physical soil deterioration Pc compaction Pk sealing and crusting Pw waterlogging Ps subsidence of organic soils, settling of soil Pu loss of bio-productive function due to other activities (eg construction, mining)
Land Degradation types (1) Land Degradation types (1) (WOCAT 2008) B: Biological degradation Bc reduction of vegetation cover Bh loss of habitats Bq quantity / biomass decline Bf detrimental effects of fires Bs quality and species composition / diversity decline Bl loss of soil life Bp Increase of pest / diseases, loss of predators H: Water degradation Ha aridification / soil moisture problem Hs change in quantity of surface water Hg change in groundwater / aquifer level Hp decline of surface water quality Hq decline of groundwater quality Hw reduction of the buffering capacity of wetland areas 12
Degradation Degradation Degree Degree Degree: intensity of the land degradation process 1 Light: there are some indications of degradation, but the process is still in an initial phase. It can be easily stopped and damage repaired with minor efforts. 2 Moderate: degradation is apparent, but its control and full rehabilitation of the land is still possible with considerable efforts. 3 Strong: evident signs of degradation. Changes in land properties are significant and very difficult to restore within reasonable time limits. 4 Extreme: degradation beyond restoration. 13
3 3 14
Degradation Rate Degradation Rate Rate: indicate the trend of degradation over a recent period of time 3: rapidly increasing degradation 2: moderately increasing degradation 1: slowly increasing degradation 0: no change in degradation -1: slowly decreasing degradation -2: moderately decreasing degradation -3: rapidly decreasing degradation 15
Direct causes of land degradation Direct causes of land degradation s: Soil management: improper / cultivation of unsuitable soils a: Crop and rangeland management: improper f: Deforestation and removal of natural vegetation e: Over-exploitation of vegetation for domestic use g: Overgrazing i: Industrial activities and mining u: Urbanisation and infrastructure development p: Discharges leading to point contamination of surface and ground water resources q: Causes leading to non-point contamination of surface and ground water resources w: Disturbance of the water cycle o: Over abstraction of water n: Natural causes 16
Indirect causes of land degradation Indirect causes of land degradation p: Population density t: Land tenure h: Poverty / wealth l: Labour availability r: Inputs and infrastructure e: Education, access to knowledge and support services w: War and conflict g: Governance / institutional o: Others (specify) 17
Impact on Ecosystem Services Impact on Ecosystem Services & Indicators P (P1) (P2) (P3) E (E1) (E2) (E3) (E4) (E5) Productive Services & indicators production (of animal / plant quantity and quality including biomass for energy) and risk water (quantity and quality ) for human, animal and plant consumption land availability Ecological services (regulating / supporting) & indicators water cycle: floods, storms, excessive rains water cycle: drought, dry season flow, availability of water organic matter status soil cover (vegetation, mulch, etc.) soil structure: surface (eg sealing and crusting) and subsoil affecting infiltration, water and nutrient holding capacity, salinity etc. nutrient cycle (N, P, K) and the carbon cycle (C) soil formation (including wind-deposited soils) biodiversity greenhouse gas emission (E10) (micro)-climate (wind, shade, temperature, humidity) S Socio-cultural services and human well-being & indicators (S1) spiritual, aesthetic, cultural landscape and heritage values, recreation and tourism, (S2) education and knowledge (including indigenous knowledge) (S3) conflicts (S4) food security, health and poverty (S5) net income (S6) private and public infrastructure (buildings, roads, dams, etc.) (E6) (E7) (E8) (E9) (WOCAT 2008) 18
Level of impact (on Ecosystem Level of impact (on Ecosystem Services) Services) -3 high negative influence: land degradation contributes negatively (more than 50%) to changes in ES -2 negative influence: land degradation contributes negatively (10-50%) to changes in ES -1 low negative influence: land degradation contributes negatively (0-10-%) to changes in ES. 0 no impact, i.e. no or negligible change ecosystem service +1 low positive influence: land degradation contributes positively (0-10%) to the changes in ES +2 positive influence: land degradation contributes positively (10-50%) to the changes in ES +3 high positive influence: land degradation contributes positively (more than 50%) to changes in ES. 19
Step 4: Sustainable Land Management Give the name of the most widespread technologies for each mapping unit Conservation/SLM per LUS Name / Group / Measure Extent (area) Effectiveness Effectiveness trend Impact on ecosystem services (type and level) Degradation addressed 21
Conservation Groups Conservation Groups CA: Conservation agriculture / mulching NM: Manuring / composting / nutrient management RO: Rotational system / shifting cultivation / fallow /slash and burn VS: Vegetative strips / cover AF: Agroforestry AP: Afforestation and forest protection RH: Gully control / rehabilitation TR: Terraces GR: Grazing land management WH: Water harvesting SA: Groundwater / salinity regulation / water use efficiency WQ: Water quality improvements SD: Sand dune stabilization CB: Coastal bank protection PR: Protection against natural hazards SC: Storm water control, road runoff OT: Other: (specify) 22
3 3 23
The challenge: Stage of SLM intervention Purpose Mitigation / Cure Mitigation / Cure Rehabilitation / Restoration Rehabilitation / Restoration Prevention Prevention Fotos: H.P. Liniger
Effectiveness of implemented SLM technologies Effectiveness: how much it reduces the degree of degradation or how well it is preventing degradation 4: Very high 4: Very high: the measures not only control the land degradation problems appropriately, but even improve the situation compared to the situation before degradation occurred. 3 3: High : High: the measures control the land degradation problems appropriately. The measures are able to stop further deterioration, but improvements are slow. 2: Moderate 2: Moderate: the measures are acceptable for the given situations. However, the measures only slow down the degradation process, but are not sufficient. 1: Low 1: Low: the measures need local adaptation and improvement in order to reduce land degradation to acceptable limits.
Effectiveness trend 1: 1: increase in effectiveness: the measures have a growing positive impact on the reduction of degradation 0: 0: no change in effectiveness - -1: 1: decrease in effectiveness: the measures have less and less effect in reducing degradation, e.g. due to lack of maintenance
Impact on Ecosystem Services Impact on Ecosystem Services & Indicators P (P1) (P2) (P3) E (E1) (E2) (E3) (E4) (E5) Productive Services & indicators production (of animal / plant quantity and quality including biomass for energy) and risk water (quantity and quality ) for human, animal and plant consumption land availability Ecological services (regulating / supporting) & indicators water cycle: floods, storms, excessive rains water cycle: drought, dry season flow, availability of water organic matter status soil cover (vegetation, mulch, etc.) soil structure: surface (eg sealing and crusting) and subsoil affecting infiltration, water and nutrient holding capacity, salinity etc. nutrient cycle (N, P, K) and the carbon cycle (C) soil formation (including wind-deposited soils) biodiversity greenhouse gas emission (E10) (micro)-climate (wind, shade, temperature, humidity) S Socio-cultural services and human well-being & indicators (S1) spiritual, aesthetic, cultural landscape and heritage values, recreation and tourism, (S2) education and knowledge (including indigenous knowledge) (S3) conflicts (S4) food security, health and poverty (S5) net income (S6) private and public infrastructure (buildings, roads, dams, etc.) -3 : high negative impact -2 : negative impact -1 : low negative impact (E6) (E7) (E8) (E9) 1 : low positive impact 2 : positive impact 3 : high positive impact (WOCAT 2008) 28
Implemented SLM technologies Period Period of of implementation implementation: Indicate since what year the technology has been implemented Reference Reference to to QT: QT: If more detailed information is available in a the questionnaire of SLM Technologies (QT) please add their reference number. Remarks Remarks 29
Step 5: Expert recommendation Recommendation on best intervention Recommendation on best intervention A A deal with and is accepted as a fact of life, or it is not worthwhile the effort to invest in. Adaptation Adaptation to the problem: the degradation is either too serious to P P natural resources and their environmental and productive function on land that may be prone to further degradation Prevention Prevention implies the use of conservation measures that maintain M M Mitigation Mitigation: is intervention intended to reduce ongoing degradation. R R such an extent that the original use is only possible with extreme efforts as land has become practically unproductive. Rehabilitation Rehabilitation: is intervention when the land is already degraded to 31
Step 5: Expert recommendation Suggested interventions on how to address land degradation 32


")


")
")
")