Importance of Nutrition in Food Security: Evidence from Bangladesh
Nutrition plays a crucial role in food security as it ensures access to adequate food for a healthy life. Effective biological utilization of food is essential along with availability and access. Investments in nutrition have high returns, with Bangladesh showing success in reducing stunting rates. Key factors like child nutrition, food/nutrient intake, and maternal care practices impact food utilization and overall health in Bangladesh.

Download Presentation

Please find below an Image/Link to download the presentation.
The content on the website is provided AS IS for your information and personal use only. It may not be sold, licensed, or shared on other websites without obtaining consent from the author. Download presentation by click this link. If you encounter any issues during the download, it is possible that the publisher has removed the file from their server.
E N D
Presentation Transcript
Why is Nutrition an Important Component of Food Security? Evidence-Based Rationale for Bangladesh Akhter Ahmed Country Representative for Bangladesh International Food Policy Research Institute Training Workshop on Concepts and Tools for Food Policy Analysis Dhaka | 1 March 2019
Food Security: Conceptual Framework 2
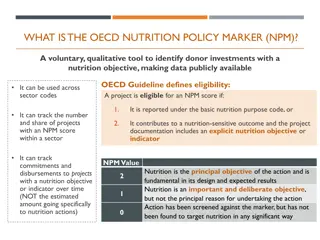
Why is nutrition an important component of food security? Food security: Access by all people at all times to sufficient food to meet their dietary needs for a healthy and productive life. 3 components: Availability of adequate food at the national level. Access to adequate food at household and individual levels. Effective biological utilization of food. Availability of and access to adequate food are necessary, but not sufficient for a healthy life. Hence, the third essential element of food security is the effective biological utilization of food, which depends on many factors (e.g., health and sanitation, household or public capacity to care for the vulnerable). The ultimate goal of ensuring food security is to improve the well-being, health, and nutrition of the population. 3
Conceptual Framework Child Nutrition Immediate Causes Food/Nutrient Intake Health Maternal & Child Care Practices Water, Sanitation & Health Services Availability of food Access to food Underlying Causes Source: Adapted from UNICEF 1990 4
Understanding Food Utilization: Nutrition Scenario in Bangladesh 5
Investments in nutrition have high returns Economic returns to US$ 1 invested in reducing stunting The return is $18.40 in Bangladesh Indonesia Philippines Vietnam India Pakistan Nigeria Sudan Kenya Bangladesh Burma Tanzania Uganda Yemen Nepal Ethiopia Madagascar DRC 0 10 20 US$ 30 40 50 6 Source: Hoddinott et al. 2013, IFPRI; Eggersdorfer et al. 2013
Bangladesh has been one of the most successful countries at reducing preschooler stunting rates 70 Percent of children stunted (<-2 z score) 59 60 50 50 50 44 40 40 36 31 30 20 10 0 1997 2000 2004 2007 2011 2014 2018 Source: DHS, various years 7
Regional differences in percentage of under-5 children who are stunted 60 Percent of children under-5 stunted (<-2 HAZ) 49.6 49.3 50 45.1 43.3 42.9 41.3 41.3 39.9 38 40 36.1 36 34.1 33.9 33.7 31.1 28.1 30 20 10 0 Barisal Chittagong Dhaka Khulna Rajshahi Rangpur Sylhet Rural Bangladesh 2011 2014 Source: DHS 2011 and 2014 8
Evidence from IFPRIs Bangladesh Integrated Household Survey (BIHS) Data 9
IFPRI has created a comprehensive dataset for food policy analysis in Bangladesh IFPRI s Bangladesh Integrated Household Survey (BIHS): most comprehensive nationally rural household panel survey to date. 3-round panel survey: Round 1: 2012 Round 2: 2015 Round 3: 2019 4 unique features of data collection: 1. Plot-level agricultural production 2. Individual food intakes of all HH members 3. Anthropometry measurements of all HH members 4. Data to measure the Women s Empowerment in Agriculture Index (WEAI) 10
Most Bangladeshi farmers grow one crop Rice 60 60 54.4 51.0 50 50 Percentage of farmers Percentage of farmers 40 40 30 30 20.1 20 20 12.5 10 10 5.9 3.9 0 0 1 1 2 2 3 3 4 4 5 5 Only rice Only rice Number of crops grown in 2011 Number of crops grown in 2011 Source: IFPRI 2012 Bangladesh Integrated Household Survey (BIHS) 11
Overwhelming rice dominance in Bangladeshi diet Share of rice in total nutrient intakes 90 78 80 71 Percent of total nutrient intake 70 67 70 63 62 57 60 52 52 46 50 44 36 40 30 20 10 0 Food energy (calorie) Protein Zinc Iron All Poorest 20% Richest 20% Source: IFPRI 2012 Bangladesh Integrated Household Survey (BIHS) 12
Nutrient intakes by income groups 2,483 2,378 70 2,275 2400 2,202 65.9 60 Vitamin A intakes (micrograms/person/day) 1,984 2100 Zinc intakes (milligrams/person/day)) Iron intakes (milligrams/person/day) Protein intakes (grams/person/day) 55.5 55.5 Calorie intakes (kcal/person/day) 50 51.9 1800 45.0 40 1500 30 1200 20 900 11.6 10.8 10.1 9.5 8.1 10 600 8.2 7.6 7.1 6.7 5.9 0 300 251 223 197 192 190 0 -10 1 (lowest) 2 3 4 5 (highest) Calorie Vitamin A Protein Iron Zinc Source: IFPRI BIHS 2011/12 13
Stunting for under-5 children reduces as income increases, yet sizable number of children from rich households are stunted 60 48.9 50 Prevalence of stunting (%) 38.8 37.7 40 37.1 35.2 27.7 30 20 10 0 1st Quintile (Poorest) 2nd Quintile 3rd Quintile 4th Quintile 5th Quintile All (Richest) Source: BIHS 2011/12 14
A paradox: stunting is highest in regions of lowest poverty, and vice versa Child stunting Poverty Source: WFP 2012 15
Paradox is partly explained by regional difference in women s empowerment 70 61.3 Women s empowerment (WEAI) headcount (%) 60 Sylhet Division: lowest women s empowerment, second highest income Barisal Division: second highest women s empowerment, second lowest income 47.2 46.8 50 42.3 41.7 38.3 40 30 23.2 20 10 0 Source: IFPRI BIHS 2015 16 16
High rate of adolescent pregnancies is associated with stunting in Bangladesh IFPRI BIHS data show: 58% of girls in rural areas get married before age 18 Age at child birth and rate of stunting 58.3 60 50 40.8 Stunting prevalence (%) 39.8 40 Adolescent girls aged <19 account for 36% of all child births in rural Bangladesh 34.2 30 20 Early marriage Early pregnancy Low birthweight Stunting 10 0 <15 15-16 17-18 19-20 Age groups (years) Source: IFPRI BIHS 2015 Source: DHS 2014 17
Dietary Diversity Measures IYCF indicators Household DD Women s DD Minimum DD MAD Target Population: All household members 15-49 years 6-23 months 6-23 months # of Food Groups: 12 9 7 6 (non-breastfed) 7 (breastfed) Reference Period: 24-hour recall 24-hour recall 24-hour recall 24-hour recall Proxy measure for food security Individual measures are good indicators of diet quality 18
Desirable Dietary Patterns and Actual Food Intakes Gaps reduced from 2011 to 2015 19 Source a: Desirable Dietary Patterns (DDP) 2013 Source b: IFPRI BIHS 2011 and 2015
Calculation of the WFP Food Consumption Score to Measure Diet Quality (# of days consumed of each food group in past 7 days, weighted by nutritional importance ) 20
Household Diet Quality Improved (Estimated WFP s Food Consumption Score: 0-112) Percentage of households with low FCS (<42) 25 Average FCS 80 23.1 66.7 70 20 56.4 60 Food consumption score 50 15 Percent 40 10 8.4 30 20 5 10 0 0 2011/12 2015 2011/12 2015 Source: IFPRI BIHS 2011/12 and 2015 21
Household Diet Quality is Worse for the Poor, but Quality Improved for All (using WFP s Food Consumption Score: 0-112) Average FCS 90 79.7 80 72.7 71.0 Food Consumption Score 67.0 66.7 70 61.4 62.7 56.4 60 55.5 52.6 50.5 50 42.3 40 30 20 10 0 1st Quintile (Poorest) 2nd Quintile 3rd Quintile 4th Quintile 5th Quintile (Richest) All 2011/12 2015 Source: IFPRI BIHS 2011/12 and 2015 22
Percentage of Households With Low Diet Quality Declined(using WFP s Food Consumption Score: 0-112) Percentage of households with low FCS (<42) 60 55.2 50 40 Percent 27.9 30 25.0 23.1 19.6 20 9.9 8.6 8.4 10 4.4 3.0 2.6 1.2 0 1st Quintile (Poorest) 2nd Quintile 3rd Quintile 4th Quintile 5th Quintile (Richest) All 2011/12 2015 Source: IFPRI BIHS 2011/12 and 2015 23
Frequency of Food Groups Consumed in Past 7 Days Increased on Average 8 Number of days each food group was consumed in 7.0 7.0 7.0 6.9 6.9 6.9 7 6 5.5 4.8 5 past 7 days 4 3.5 3 2.7 2.4 2.3 2.1 1.6 2 1.6 1.2 1 0 2011/12 2015 Source: IFPRI BIHS 2011/12 and 2015 24
Proportion of People Who Have Not Consumed Food Groups in Past 7 Days Declined Average food consumption frequency hides severity 70 65.2 Percentage of people without consumption 60 of food group in past 7 days 52.0 47.4 50 43.8 41.2 40 29.3 30 23.9 23.0 20 10 4.5 2.4 0.0 0.4 0.8 0.2 0.0 0.0 0 2011/12 2015 Source: IFPRI BIHS 2011/12 and 2015 25
What Factors Affect Diet Diversity? Random-effects GLS Panel Regression Results Dependent variable: Food Consumption Score Variable list Demography Education Education Coeff. 0.017 0.784*** -0.007 Robust Std. Err. 0.028 0.174 0.005 z P>z 0.540 0.000 0.171 Age of household head Household size Child dependency ratio 0.61 4.51 -1.37 Aged dependency ratio Completed primary Completed secondary 0.011** 0.197 1.483* 0.005 0.680 0.765 2.06 0.29 1.94 0.040 0.772 0.053 (male) Higher secondary or more Completed primary Completed secondary 4.150** 1.949*** 3.463*** 1.641 0.674 0.797 2.53 2.89 4.35 0.011 0.004 0.000 (female) Higher secondary or more No. of rice crops grown last year No. of non-rice food crops grown last year Rice price No. of milking cow No. of poultry HH engaged in fisheries HH owned land (decimals) HH has mechanical irrigation Non-farm income share WEAI score: Women's empowerment HH received remittance Access to electricity HH has mobile phone Total asset HH in coastal districts District fixed effects included 4.027* -0.101 0.248** 0.475*** 1.932*** -0.002 1.271** 0.011*** 1.154 0.022*** 11.018*** 2.716*** 2.146*** 4.648*** 0.000*** -3.904*** Yes 2.113 0.066 0.104 0.071 0.254 0.004 0.544 0.003 0.809 0.007 1.788 0.720 0.553 0.711 0.000 1.786 1.91 -1.52 2.38 6.69 7.61 -0.5 2.34 3.73 1.43 3.11 6.16 3.77 3.88 6.54 3.57 -2.19 0.057 0.128 0.017 0.000 0.000 0.619 0.019 0.000 0.154 0.002 0.000 0.000 0.000 0.000 0.000 0.029 Agriculture Other factors Asterisks indicate *significant at 10%, ** significant at 5%, *** significant at 1%. 26
What Factors Affect Diet Diversity? Using random effects panel regression, we estimated determinants of diet diversity using two different measures FCS and HDDS. We obtain similar results from both regressions. We find that diet diversity improves if: Household male head and female spouse have higher levels of education Agricultural diversity increases: Household grew higher number of non rice food crops last year Women are more empowered (measured by WEAI) Rice price increases Household have higher number of milking cows and are engaged in fisheries Non-farm income share increases; have access to electricity, own cell phone and have higher asset holdings. 27
Males Have Higher Calorie Intake for All Age Groups 3000 2832 2740 Per capita daily calorie intake (kcal/day) 2416 2390 2500 2297 2244 2067 1910 2000 1558 1535 1500 1000 500 0 5-<10 10-<18 18-<40 40-<65 65 Age group Male Female Source: IFPRI BIHS 2011/12 28
But Females Have Slightly Higher Calorie Adequacy (taking individual s activity levels into account) 95.8 93.8 100 93.7 90.3 90.1 84.4 86.7 87.4 86.6 85.3 90 80 Calorie adequacy (%) 70 60 50 40 30 20 10 0 5-<10 years 10-<18 years 18-<40 years 40-<65 years 65 years Age group Male Female Source: IFPRI BIHS 2011/12 29
Prevalence of Underweight is Higher Among Male, Except for the Elderly (measured by BMI and age-specific cutoffs) 45 41.6 40.6 40.5 38.5 40 35.4 35 Prevalence of underweight (%) 30 24.6 23.9 25 22.3 21.9 18.9 20 15 10 5 0 5 - 10 years 11 - 19 years 20 - 40 years 41 - 60 years Above 60 years Age group Male Female 30
Prevalence of Underweight > Age 17 by Income (measured by BMI < 18.5) 45 40 38.0 Prevalence of underweight (%) 35 32.7 30 27.9 27.5 26.3 24.6 23.3 25 22.2 19.6 20 17.8 15.8 15 13.4 10 1st Quintile (Poorest) 2nd Quintile 3rd Quintile 4th Quintile 5th Quintile (Richest) All Per capita household expenditure quintile (proxy for income) Male Female 31
Prevalence of Overweight Increases as Income Increases (measured by BMI age-specific cutoffs) 20 18.1 Prevalence of overweight (%) 15 11.2 10.8 9.6 10 8.6 8.5 7.9 6.0 5.2 4.7 5 3.2 2.6 0 1st Quintile (Poorest) 2nd Quintile 3rd Quintile 4th Quintile 5th Quintile (Richest) All Per capita household expenditure quintile (proxy for income) Male Female Source: IFPRI BIHS 2011/12 32
Building Synergy Across Food Security Components: Nutrition-Sensitive Agriculture and Nutrition-Sensitive Social Protection 33
Build Synergies Across 3 Components of Food Security Access Availability Utilization Food Security Nutrition-Sensitive Agriculture Nutrition-Sensitive Social Protection
What are the main food availability and food access issues for nutrition in Bangladesh? Availability Bangladesh has made remarkable progress in foodgrain production, but improvements in child and maternal nutrition warrant further attention. Agriculture provides a source of food and nutrients, a broad- based source of income, and affects food prices. Given these links, agriculture has the potential to be a strong driver of nutrition. However, that potential is not being realized. Access Social safety nets are important for improving food access for the poor, and have been quite effective in smoothing the consumption and the income of poor households in Bangladesh. However, most existing evidence from evaluations (by IFPRI and others) of major safety nets in Bangladesh show few improvements in child nutritional status. This leads to a key question: Are there constraints other than income, such as nutrition knowledge, that also need to be addressed? 35
Influence of Agriculture on Diet Quality Evidence from IFPRI research in Bangladesh Increased agricultural diversity improves household dietary diversity (Sraboni et al. 2014) Increased women s empowerment in agriculture (measured by WEAI) helps Improve household, child, and maternal dietary diversity; (Sraboni et al. 2014) Increase agricultural diversity (Ahmed & Sraboni 2014) Nutrition behavior change communication (BCC) training for women and men improves household diet quality, child nutrition and complementary feeding practices (TMRI: Ahmed et al. 2016; A&T: Menon et al. 2016). 36
Agriculture, Nutrition, and Gender Linkages (ANGeL) Project: Background Motivated by IFPRI research findings, IFPRI researchers developed a concept note for the Ministry of Agriculture to strengthen the agriculture-nutrition-gender nexus in June 2014. Government approved ANGeL project in September 2015 for implementation by Ministry of Agriculture. On October 29, 2015, Honorable Minister of Agriculture launched the ANGeL project. ANGeL draws on the government s nationwide agricultural extension network, topping-up their portfolio with nutrition activities and messages. 37
ANGeL Project Design ANGeL is a research project implemented by the Ministry of Agriculture in 16 of 64 districts in Bangladesh. IFPRI evaluated impacts of 3 interventions and their 5 combinations using clustered randomized controlled trial (RCT) method. Interventions are: 1. Agriculture Production: Facilitating the production of the high-value food commodities rich in essential nutrients. The focus is on diversifying agricultural production (fruits and vegetables, pulses, oilseeds, poultry, dairy, fish, livestock) 2. Nutrition BCC: Imparting high-quality behavior change communication (BCC) to farmers to improve nutrition. 3. Gender Sensitization: Undertaking activities to improve status of women, and gender parity between women and men. 38
Impacts of ANGeL IFPRI-PRSSP evaluation of ANGeL found a number of positive impacts across the three target domains: Agriculture: Improved knowledge of improved practices, especially among women, and increased crop diversity and production of non-staple crops Income: Increased farm income from production of non-staple crops. Nutrition: Improved knowledge, especially among women, and increased household diet quality and child diet diversity Women s empowerment: Women became more empowered in asset ownership and income decisions, men became more empowered in production and income decisions in select interventions.
ANGeL Policy Uptake The ANGeL project is the first ministry-led initiative in Bangladesh that used a rigorous impact evaluation to develop an evidence base for designing and implementing a national program. IFPRI presented the findings of ANGeL the evaluation in Dhaka in June 2018 in a dissemination seminar. In January 2019, the Ministry of Agriculture approved expanding ANGeL nationally in particular, rolling out the combination of interventions that were found to be most effective under ANGeL: trainings to men and women in farm households on improved agricultural production practices for high-nutritive-value crops, nutrition, and gender sensitization. The workplan for scaling up ANGeL is being developed by the Ministry in consultation with IFPRI-PRSSP.
Nutrition-Sensitive Social Protection: Transfer Modality Research Initiative (TMRI) TMRI, designed by IFPRI and implemented by WFP from 2012- 2014, generated definitive evidence on which safety net transfer modalities work best for the ultra-poor in rural Bangladesh: food or cash transfers with or without intensive nutrition behavior change communication (BCC). Results show combining cash income transfer and high quality nutrition knowledge is most effective at improving child nutrition: Cash + nutrition BCC led to a 7.3 percentage points decrease in child stunting over the project period three times greater than national average decline in stunting. Cash + BCC reduced intimate partner violence by 26%.
Adding BCC increases the frequency of several food groups consumed by children <42 months: North TMRI results 40 Percent of children who consumed 36.0 35 in past 24 hours 30 24.6 25 22.8 20 15.1 15 11.7 10.9 10 7.3 6.4 6.1 5 0 Eggs Legumes Legumes Eggs Legumes Dairy products Flesh foods Eggs Vit A fruit and veg Cash Food Cash & Food Cash & BCC 42
43 Policy Influence of TMRI TMRI evidence is prompting the Bangladesh government and development partners to consider adding nutrition BCC into social protection programs. For example, encouraged by TMRI results, the Ministry of Women and Children Affairs (MoWCA) added nutrition BCC to the Investment Component for Vulnerable Group Development (ICVGD) program for destitute women. 43
Joint Interventions for Birth Outcomes on Nutrition (Jibon) Study TMRI research in Bangladesh shows that cash transfer and high-quality nutrition behavior change communication (BCC) greatly improve child nutrition. Yet a better understanding is needed on the effectiveness of different transfer packages and BCC towards improving maternal and newborn outcomes. IFPRI has designed a randomized controlled trial for the Government s Improved Maternity and Lactating Mother Allowance program (now termed Jibon) to assess how to best improve maternal and newborn outcomes. Together with the Ministry of Women and Children Affairs (MOWCA) and WFP, IFPRI conducts the Jibon study targeting poor pregnant women in 7 rural upazilas (subdistricts). Results may inform MOWCA on which design can most (cost-) effectively improve maternal and child health and nutrition in Bangladesh at scale.
Jibon Study Interventions Intervention 1: Cash MMS Tk800/month Intervention 2: Cash BCC MMS Tk800/month Intervention 3: BCC Food Basket MMS Cash Tk800/month Intervention 4: Cash MMS Extra Cash Tk800 BCC Tk800/month
Policy Considerations for Improving Nutrition Security 46
Policy Considerations: Reduce Child Stunting Child stunting in Bangladesh has dropped, but remains high at 31%. Major causes of stunting in Bangladesh: Inadequate maternal nutrition during pregnancy. Inadequate infant and young child dietary intake. To reduce child undernutrition, focus on: Improving maternal nutrition during pregnancy Improving child nutrition postnatally
Policy Considerations: Promote Nutrition- Sensitive Agriculture (1 of 3) Promote agricultural diversity: Reduce risk of high-value, high nutritive value food production via contract farming, agricultural credit, etc. Create an enabling policy environment for the private sector for agricultural value chains development. Invest in research on productivity of rice, non-rice crops, livestock, and fisheries. Promote rice intensification and agricultural diversification via agricultural extension. 48
Policy Considerations: Promote Nutrition- Sensitive Agriculture (2 of 3) Promote biofortified crop production HarvestPlus and BRRI developed 4 varieties of zinc-fortified rice. HarvestPlus is also working with BARI on biofortified lentil and sweet potatoes. Ministry of Food through its Public Food Distribution System (PFDS) can procure zinc-fortified rice from farmers at a premium price, which can incentivize farmers to grow biofortified rice. Promote distribution of biofortified crops in safety nets PFDS can create institutional demand for biofortification by distributing zinc-fortified rice to safety net programs as PFDS outlets. 49
Policy Considerations: Promote Nutrition- Sensitive Agriculture (3 of 3) The ANGeL project, designed by IFPRI and implemented by the Ministry of Agriculture, is promoting nutrition-sensitive agriculture. Improve diet quality: Develop value chains for nutrient-dense foods. Promote nutrition knowledge among consumers, farmers, and women and men. Support women s empowerment: Women s empowerment in agriculture improves dietary diversity, increases agricultural diversity, and helps households move out of poverty (IFPRI 2016). Therefore, promoting women s empowerment remains paramount to attain complementary development goals. 50