Impact of COVID-19 on Community College Enrollment Trends
The spring 2021 report highlights the significant decline in community college enrollments, with traditional college age students suffering the most. The Fall 2020 full-time enrollment at Massachusetts community colleges saw a notable decrease, with varying percentages of decline across different institutions. The report provides detailed figures and charts illustrating the changes from Fall 2019 to Fall 2020.

Download Presentation

Please find below an Image/Link to download the presentation.
The content on the website is provided AS IS for your information and personal use only. It may not be sold, licensed, or shared on other websites without obtaining consent from the author. Download presentation by click this link. If you encounter any issues during the download, it is possible that the publisher has removed the file from their server.
E N D
Presentation Transcript
MCCC Research Coordinator Research Report -- Spring 2021 Hilaire Jean-Gilles Phone: 781-436-5447 Email: Research@mccc-union.org
Spring 2021 Full-time Enrollment (FTE) national trends across the Community Colleges Due to the persistent impact of COVID-19, the higher education enrollment hits its new lows in spring 2021. According to the National Student Clearinghouse Research Center, over 65% of the total undergraduate enrollment losses occurred in the community college sector. Community colleges remain the worst-hit sector by COVID-19 with 9.5% fewer students among all the undergraduate institutions. Traditional college age students (age 18-24) suffer the most decline (-5%) among all age groups. This is largely attributable to their steep losses of 13.2% at community colleges. Adult students (25 or older), on the other hand, show a 2 to 3 percent gain at public 4-year and private nonprofit 4-year colleges.
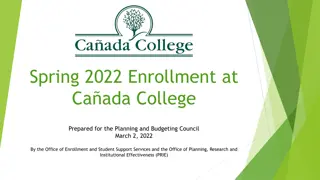
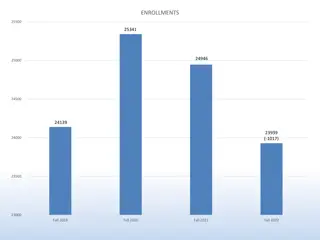
Fall Credit Full-time Enrollment (FTE) at Massachusetts Community Colleges Fall 2020 students FTE enrollment plummeted by 12% compared to fall 2019 which was averaging 4% decline. In fall 2020, RCC registered the highest decline in student FTE followed by HCC, BHCC, MASCC, and STCC respectively. The tables and charts in the next slides provide counts of the fall 2020 enrollment figures per college.
Fall Credit Full-time Enrollment (FTE) at Massachusetts Community Colleges % change of FTE fall 2019-fall 2020 Institution Fall 2010 Fall 2011 Fall 2012 Fall 2013 Fall 2014 Fall 2015 Fall 2016 Fall 2017 Fall 2018 Fall 2019 Fall 2020 Berkshire 1,634 1,557 1,501 1,379 1,295 1,237 1,127 1,058 967 923 811 -12% Bristol 5,629 5,729 5,793 6,009 5,978 5,789 5,559 4,874 4,574 4,401 4,037 -8% Bunker Hill 6,925 7,366 7,683 7,936 7,953 7,677 7,540 7,511 7,223 6,818 5,761 -16% Cape Cod 2,628 2,454 2,362 2,286 2,101 2,032 1,827 1,837 1,669 1,657 1,559 -6% Greenfield 1,617 1,547 1,485 1,345 1,268 1,224 1,147 1,039 1,036 992 878 -12% Holyoke 5,006 4,822 4,829 4,560 4,371 4,197 3,833 3,648 3,339 3,056 2,529 -17% Mass Bay 3,525 3,308 3,323 3,270 3,201 2,842 2,837 2,700 2,543 2,407 2,175 -10% Massasoit 4,966 5,069 5,074 5,121 4,915 4,745 4,602 4,411 4,180 3,946 3,321 -16% Middlesex 5,921 5,873 5,816 5,778 5,640 5,486 5,127 4,897 4,599 4,400 3,858 -12% Mt. Wachusett 3,055 2,957 2,965 2,941 2,739 2,561 2,514 2,337 2,272 2,206 1,874 -15% North Shore 5,099 4,970 4,847 4,776 4,421 4,127 3,714 3,601 3,380 3,203 2,810 -12% Northern Essex 4,523 4,255 4,482 4,413 4,127 3,951 3,606 3,425 3,080 2,935 2,716 -7% Quinsigamond 5,594 5,654 5,601 5,248 5,156 4,896 4,680 4,484 4,352 4,266 4,096 -4% Roxbury 1,667 1,734 1,679 1,455 1,435 1,347 1,214 1,142 1,158 1,015 683 -33% Springfield Technical 4,439 4,468 4,562 4,500 4,348 4,011 3,620 3,433 3,169 3,267 2,747 -16% Total 62,226 61,761 62,001 61,017 58,947 56,119 52,947 50,396 47,540 45,494 39,855 -12% Source: Massachusetts Department of Higher Education
Some Key facts about full-time faculty salaries nationwide The COVID-19 pandemic has not only had its impact on certain parts of the economy and society, but it has also affected faculty compensation at certain types of institutions, at certain ranks, more than others. According to preliminary data from AAUP s annual Faculty Compensation Survey, the average faculty pay fell by 0.4 percent this year, adjusting for inflation, the first such decrease since 2011-12. Because some of the lowest-paid professors got laid off during the pandemic, faculty salaries from some institutions increase this year compared to the previous year.
Some Key facts about full-time faculty salaries nationwide (continued) Professor pay decreased at two-thirds of colleges and universities, adjusted for inflation. Wage growth for full-time professors in 2020-21 was the lowest since the AAUP began tracking this growth in 1972. At community colleges nationwide and on average, full professors made $91,196, associates made $75,550 and assistants made $64,823. Instructors and lecturers made $54,547 and $68,641, respectively. But at community colleges without faculty ranking systems, average salaries decreased 2.7 percent, or 4.1 percent considering inflation. The tables and charts in the next slides provide snapshots of faculty salary figures per college.
Average full-time faculty salaries by rank in the community college system of Massachusetts Rank Average full-time faculty salaries spring 2016 Average full-time faculty salaries spring 2017 Average full-time faculty salaries spring 2018 Average full-time faculty salaries spring 2019 Average full-time faculty salaries spring 2020 Average full-time faculty salaries spring 2021 Professor $72,283 $75,068 $74,285 $73,183 $76,634 $75,204 Associate Professor $59,154 $61,144 $60,871 $60,571 $64,081 $63,867 Assistant Professor $54,138 $57,058 $56,389 $56,317 $60,302 $59,855 Instructor $49,582 $54,387 $54,800 $54,920 $56,583 $57,318 Percentage changes of average full-time faculty salaries by rank from 2016 to 2021 Rank Percentage change spring 2016 to 2017 Percentage change spring 2017 to 2018 Percentage change spring 2018 to 2019 Percentage change spring 2019 to 2020 Percentage change spring 2020 to 2021 Professor 3.85% -1.04% -1.48% 4.72% -1.87% Associate Professor 3.36% -0.45% -0.49% 5.79% -0.33% Assistant Professor 5.39% -1.17% -0.13% 7.08% -0.74% Instructor 9.69% 0.76% 0.22% 3.03% 1.30%
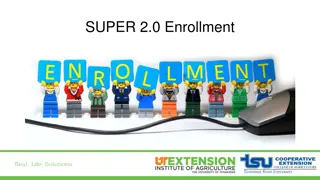
Average & median salaries for full-time faculty at Massachusetts community colleges The table below provides a snapshot of average & median salaries for full-time faculty per college. As of July 2021, the average salary for full-time faculty in the college system was $68,888 versus last year's average of $69,398. It should be noted that Quinsigamond has had the highest average salary for two consecutive years. The chart below also shows that, in general, the median salary among faculty members is not substantially less than the average salaries. In other words, the distribution of faculty members by salary level is not highly skewed.
Average Salaries for FT Faculty Media Salaries for FT Faculty Colleges Berkshire Community College $65,521 $61,787 Bristol Community College $66,830 $64,013 Bunker Hill Community College $68,795 $66,288 Cape Cod Community College $70,029 $68,671 Greenfield Community College $68,275 $65,901 Holyoke Community College $67,296 $64,953 Massasoit Community College $70,102 $66,848 MassBay Community College $69,757 $67,117 Middlesex Community College $67,264 $64,661 Mount Wachusett Community College $71,842 $68,680 Norhtern Essex Community College $66,981 $65,470 North Shore Community College $66,477 $63,864 Quinsigamond Community College $74,029 $69,959 Roxbury Community College $65,598 $60,027 Springfield Technical Community College $70,930 $66,530 Source: HR/CMS payroll
Average and Median Salaries for Full-time Faculty Spring 2021 $80,000 $70,000 $60,000 $50,000 $40,000 $30,000 $20,000 $10,000 $0 Average salaries FT faculty Median Salaries FT faculty
College Administrators v.s Full-time Faculty Ratios from 2010 to 2020 Bunker Hill Berkshire Admin to Faculty Ratios Admin to Faculty Ratios Year FT Faculty FT Admin FT Faculty FT NUP 54 51 53 52 56 56 53 58 52 52 57 2010 2011 2012 2013 2014 2015 2016 2017 2018 2019 2020 140 140 142 155 156 157 150 147 183 146 148 62 67 77 85 83 84 90 91 98 107 110 44% 48% 54% 55% 53% 54% 60% 62% 54% 73% 74% 43 46 45 47 47 47 51 49 42 35 33 80% 90% 85% 90% 84% 84% 96% 84% 81% 67% 58% Average Admin to Fac Ratio 57.36% 81.79% Bristol Cape Cod Admin to Faculty Ratios Admin to Faculty Ratios Year FT Faculty FT Admin FT Faculty FT NUP 74 71 72 73 68 67 65 69 71 70 67 2010 2011 2012 2013 2014 2015 2016 2017 2018 2019 2020 110 118 125 131 137 127 126 129 126 125 116 74 84 91 98 75 80 80 79 75 68 75 67% 71% 73% 75% 55% 63% 63% 61% 60% 54% 65% 48 46 50 53 49 50 50 55 52 55 58 65% 65% 69% 73% 72% 75% 77% 80% 73% 79% 87% Average Admin to Fac Ratio 64.28% 73.95%
Greenfield Holyoke Admin to Faculty Ratios Admin to Faculty Ratios Year FT Faculty FT Admin FT Faculty FT NUP 131 131 129 125 126 131 128 128 124 118 116 2010 2011 2012 2013 2014 2015 2016 2017 2018 2019 2020 59 62 60 62 56 60 58 56 50 49 51 36 38 37 36 36 38 38 31 31 34 33 61% 61% 62% 58% 64% 63% 66% 55% 62% 69% 65% 94 85 81 81 82 81 80 86 91 88 80 72% 65% 63% 65% 65% 62% 63% 67% 73% 75% 69% Average Admin to Fac Ratio 62.42% 67.07% Massasoit MassBay Admin to Faculty Ratios Admin to Faculty Ratios Year FT Fac FT Admin FT Fac FT NUP 2010 2011 2012 2013 2014 2015 2016 2017 2018 2019 2020 82 90 85 85 78 76 74 70 70 67 72 82 88 88 93 43 43 80 83 80 82 81 100% 98% 104% 109% 55% 57% 108% 119% 114% 122% 113% 99.84% 117 111 116 125 128 127 126 113 115 113 106 82 86 90 92 104 53 66 64 57 90 96 70.09% 77.48% 77.59% 73.60% 81.25% 41.73% 52.38% 56.64% 49.57% 79.65% 90.57% 68.23% Average Admin to Fac Ratio
Middlesex Mt. Wachusett Admin to Faculty Ratios Admin to Faculty Ratios Year FT Fac FT Admin FT Fac FT NUP 2010 2011 2012 2013 2014 2015 2016 2017 2018 2019 2020 121 124 123 125 133 126 222 123 118 121 111 148 141 154 157 159 152 136 109 115 117 115 122% 114% 125% 126% 120% 121% 61% 89% 97% 97% 104% 73 74 73 74 78 75 73 74 72 65 61 110 108 112 123 117 116 112 112 108 104 103 151% 146% 153% 166% 150% 155% 153% 151% 150% 160% 169% Average Admin to Fac Ratio 106.79% 154.96% North Shore Northern Essex Admin to Faculty Ratios Admin to Faculty Ratios Year FT Fac FT Admin FT Fac FT NUP 2010 2011 2012 2013 2014 2015 2016 2017 2018 2019 2020 132 137 135 133 134 129 122 124 122 120 119 91 94 98 100 93 94 93 89 85 83 84 69% 69% 73% 75% 69% 73% 76% 72% 70% 69% 71% 106 108 113 107 115 113 107 98 95 87 79 86 86 93 95 107 100 102 109 108 110 110 81% 80% 82% 89% 93% 88% 95% 111% 114% 126% 139% 99.94% Average Admin to Fac Ratio 71.37%
Quinsigamond Springfield Admin to Faculty Ratios Admin to Faculty Ratios FT Fac FT Admin FT Fac. FT NUP 128 127 136 135 136 139 141 141 134 136 135 103 101 106 115 115 119 105 119 107 115 112 80.47% 79.53% 77.94% 85.19% 84.56% 85.61% 74.47% 84.40% 79.85% 84.56% 82.96% 81.78% 148 147 147 146 145 147 150 143 138 133 124 69 70 71 81 81 42 91 18 18 15 25 46.62% 47.62% 48.30% 55.48% 55.86% 28.57% 60.67% 12.59% 13.04% 11.28% 20.16% 36.38% ???? On these NUP NUMBERS subject to confirmation from STCC Roxbury Admin to Faculty Ratios FT Fac FT Admin 128 127 136 135 136 139 141 37 37 39 40 103 101 106 115 115 119 105 51 31 47 59 80.47% 79.53% 77.94% 85.19% 84.56% 85.61% 74.47% 137.84% 83.78% 120.51% 147.50% 96.13%
College RCC RCC RCC RCC RCC RCC RCC RCC RCC RCC RCC RCC RCC RCC RCC RCC RCC RCC RCC RCC RCC RCC RCC RCC RCC RCC RCC RCC RCC RCC RCC FTE Grade Biweekly Comp $3,521.58 $3,309.50 $2,996.38 $2,092.50 $2,497.46 $2,746.85 $2,922.88 $2,197.15 $2,177.62 $2,161.77 $2,092.50 $2,318.08 $1,899.73 $2,746.86 $3,149.05 $2,328.69 $2,199.12 $2,073.50 $2,099.42 $2,308.38 $2,118.65 $2,135.38 $2,399.08 $2,466.62 $2,252.25 $3,175.46 $3,778.69 $3,379.50 $2,197.15 $2,309.08 $3,215.19 Annual column G G G F C G G G A D F B A G G E F B B G F D interval 1 6 14 25 16 21 16 25 7 30 25 22 16 21 10 26 21 17 16 35 24 19 Comments on grid on grid on grid on grid on grid on grid on grid on grid on grid on grid on grid on grid on grid on grid on grid on grid on grid on grid on grid on grid on grid on grid not on grid on grid not on grid on grid on grid on grid on grid not on grid on grid JOB TITLE Professor Professor Professor Assistant Professor Professor Professor Professor Assistant Professor Assistant Professor Associate Professor Assistant Professor Professor Instructor Professor Professor Associate Professor Assistant Professor Assistant Professor Assistant Professor Professor Assistant Professor Assistant Professor Assistant Professor Professor Unknown PT Job Code Professor Professor Associate Professor Assistant Professor Assistant Professor Professor 100 100 100 100 100 100 100 100 100 100 100 100 100 100 100 100 100 100 100 100 100 100 100 100 100 100 100 100 100 100 100 1 1 1 1 1 1 1 1 1 1 1 1 1 1 1 1 1 1 1 1 1 1 1 1 1 1 1 1 1 1 1 $91,561 $86,047 $77,906 $54,405 $64,934 $71,418 $75,995 $57,126 $56,618 $56,206 $54,405 $60,270 $49,393 $71,418 $81,875 $60,546 $57,177 $53,911 $54,585 $60,018 $55,085 $55,520 $62,376 $64,132 $58,559 $82,562 $98,246 $87,867 $57,126 $60,036 $83,595 B 17 H H H G 17 3 10 25 H 16
College Employee ID FTE Grade Biweekly Comp Annual column interval Comments JOB TITLE RCC RCC RCC RCC RCC RCC RCC RCC RCC RCC RCC RCC RCC RCC RCC RCC RCC RCC RCC RCC RCC RCC RCC RCC RCC RCC RCC RCC RCC RCC RCC RCC 223429 376329 459864 473742 376849 337655 479528 224901 488726 503331 502499 501291 465241 455225 458604 274124 214691 499514 397431 518678 437312 409577 471054 505687 246698 477025 520463 210825 289459 423621 463817 341416 100 100 100 100 100 100 100 100 100 100 100 100 100 100 100 100 100 100 100 100 100 100 100 100 100 100 100 100 100 100 100 100 1 1 1 1 1 1 1 1 1 1 2 2 2 2 3 3 4 5 5 5 5 5 5 5 6 6 6 6 6 6 6 7 $3,175.46 $2,197.15 $2,216.85 $1,982.00 $2,712.92 $2,154.85 $2,161.77 $2,827.81 $2,197.15 $2,280.58 $1,655.35 $1,718.23 $1,718.23 $1,857.31 $2,124.96 $1,986.95 $2,700.00 $2,394.69 $2,278.60 $2,278.62 $2,497.04 $2,365.15 $2,328.23 $2,405.69 $3,059.46 $2,677.51 $2,547.73 $3,854.67 $3,007.46 $2,884.69 $2,446.47 $3,161.96 $82,562 $57,126 $57,638 $51,532 $70,536 $56,026 $56,206 $73,523 $57,126 $59,295 $43,039 $44,674 $44,674 $48,290 $55,249 $51,661 $70,200 $62,262 $59,244 $59,244 $64,923 $61,494 $60,534 $62,548 $79,546 $69,615 $66,241 $100,221 $78,194 $75,002 $63,608 $82,211 H G 17 25 on grid on grid not on grid on grid on grid not on grid on grid on grid on grid on grid not on grid not on grid not on grid on grid on grid not on grid not on grid on grid on grid on grid on grid on grid not on grid not on grid on grid on grid on grid not on grid not on grid on grid not on grid on grid Professor Assistant Professor Assistant Professor Assistant Professor Professor Associate Professor Associate Professor Professor Assistant Professor Assistant Professor Biology Laboratory Technician Financial Aid Assistant Help Desk Technician Help Desk Technician Admissions Counselor Admissions Counselor Senior Admissions Counselor Librarian Academic Counselor Academic Counselor Coordinator Learning Resources Academic Counselor Coordinator Student Activities Librarian Transfer Counselor Grade 6 Learn Disab Specl/Transition Academic Counselor Coordinator Health Services Coordinator of Library Services Coordinator of Financial Aid Coordinator Student Assessment Coordinator Learning Resources D G 25 22 D B G G 30 6 25 21 B F 20 28 B E E D B 26 20 20 27 27 F B B 22 24 28 B 18 G 30
Numbers of Job Titles in the Classification System as of Spring 2021 The top four job titles in the classification system as of spring 2021 are respectively Academic Counselor, Special Programs Coordinator, Academic Coordinator, and Senior Special Programs Coordinator. It's worth noting that the number of Learning Specialists in the college system has sharply declined from 86 in spring 2020 to 27 in spring 2021. This drop in the number of Learning Specialists is probably due to the COVID-19 pandemic. Classification Specification Grade Job code Tally Classification Specification Grade Job code Tally Academic Coordinator Academic Counselor Admissions Coordinator Admissions Counselor Assessment Assistant Assessment Officer Assist Coord. Student Activ Assistant Librarian Assistant Registrar Biology Laboratory Technician Career Development Counselor Career Placement Counselor Career Services Representative Career/VetsAffairs Counselor Community/Outreach Counselor Coord. Alternative Studies Coord. Career Plan & Placement Coord. Cooperative Education Coord. Returning Adults Center Coordinator Academic Computing Coordinator Athletics HB1402 HB1051 HB0601 HB1181 HB1905 HB1100 HB1132 HB1203 HB1430 HB1210 HB1109 HB1108 HB2100 HB1161 HB1820 HB1528 HB1446 HB1316 HB1648 HB1208 HB1121 71 114 16 9 2 7 1 1 0 6 10 6 0 1 7 2 9 1 0 2 3 Enrollment Counselor ESL Skills Specialist Financial Aid Assistant Financial Aid Counselor Fitness Center Coordinator Grants Writer Health Care Counselor Help Desk Technician Instructional Support Tech Lead Teacher/Children Center Learn Disab Specl/Transition Learn. Specialist Disability Srvs Learning Specialist Librarian Literary Specialist/Adult Educ Programmer Programmer/Analyst* Publications Coordinator Recruitment Counselor Reference Librarian Senior Academic Counselor HB2122 HB1049 HB1155 HB1069 HB2306 HB1084 HB1190 HB1630 HB1218 HB1242 HB2140 HB1119 HB1106 HB1114 HB2014 HB1608 HB1607 HB1118 HB1142 HB1135 HB1125 8 0 0 1 1 3 1 4 2 0 3 5 6 3 5 4 6 2 3 2 3 2 4 4 3 3 3 2 2 2 2 3 4 6 3 5 27 14 6 0 1 0 16 13 22 2 5 4 5 3 4 6 4 6 5 4 2 5 3 6 5 6 6
Coordinator College Graphics Coordinator Disability Srvs Coordinator Financial Aid Coordinator Fine Arts Center Coordinator Forensic Lab. Coordinator Health Services Coordinator Instructional Tech Coordinator Learning Resources Coordinator Library Services Coordinator MultiCultural Cntr Coordinator Student Activities Coordinator Student Assessment Coordinator of Transfer and Articulation Coordinator TV Programming Disabilities Counselor HB1196 HB1148 HB0602 HB1227 HB1143 HB1124 HB1111 HB1088 HB0603 HB1226 HB1116 HB1232 HB0604 HB1248 HB1128 3 17 14 1 2 5 16 17 25 2 8 9 0 1 5 Senior Admissions Counselor Senior Financial Aid Counselor Senior Learning Specialist/Critical Thinking Senior Programmer Senior Special Programs Coord. Senior Staff Assistant Senior Technical Specialist* Special Programs Coordinator Sr Community/Outreach Counsel Staff Assistant Student Activity Officer Teacher/Children Center Technical Services Librarian Technical Specialist Transfer Counselor Travel Agent Program Coordinator Transfer Counselor Grade 6 HB1120 HB1192 HB1147 HB1614 HB1104 HB1212 HB1639 HB1112 HB1404 HB1160 HB2220 HB1244 HB1122 HB1158 HB1126 HB1826 HB0604 16 14 1 2 49 8 5 78 5 6 2 0 1 11 8 0 10 3 4 6 4 6 5 6 6 6 5 6 3 7 6 5 4 6 4 5 2 5 2 6 2 6 5 3 5 5 5 2 6
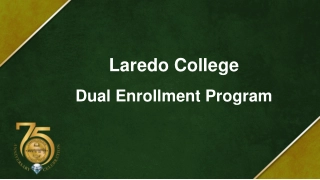
Cost of attending community colleges over the past 10 years The chart below illustrates that the cost of attending community colleges has been on the rise since 2012. From 2020 to 2021, the average cost to attend a community college in Massachusetts went up by almost 3%. Middlesex, Roxbury, Quinsigamond, and Mount Wachusett have respectively the highest total cost increases from spring 2020 to spring 2021.
FY- 2012 $5,600 5,054 4,230 4,910 5,718 4,290 5,300 4,650 5,150 5,890 4,860 4,410 5,780 4,902 4,776 $5,035 FY- 2013 $5,810 5,204 4,230 5,090 6,018 4,420 5,300 5,070 5,330 6,040 5,070 4,710 6,140 4,910 5,106 $5,230 FY- 2014 $5,810 5,204 4,230 5,090 6,018 4,420 5,300 5,070 5,330 6,040 5,070 4,860 6,140 4,910 5,106 $5,240 FY- 2015 $5,810 5,204 4,230 5,266 6,168 4,750 5,300 5,370 5,480 6,250 5,670 5,720 6,140 4,910 5,106 $5,425 FY- 2016 $6,020 5,444 4,470 5,266 6,482 5,150 5,600 5,610 5,630 6,400 5,670 5,860 6,400 5,470 5,436 $5,661 FY- 2017 $6,200 5,654 4,860 5,402 6,632 5,570 5,990 5,850 5,900 6,550 6,160 6,130 6,540 5,470 5,736 $5,910 FY- 2018 FY- 2019 FY- 2020 FY- 2021 Institution Berkshire $6,450 5,894 5,280 5,672 6,782 5,760 6,360 5,850 5,990 6,700 6,280 6,400 6,720 5,480 6,066 $6,112 $6,750 6,044 5,620 6,330 6,932 6,060 6,360 6,030 7,400 6,850 6,550 6,560 6,780 6,490 6,306 $6,471 $6,750 6,254 5,880 6,690 6,932 6,320 6,540 6,240 7,560 7,000 6,670 6,740 6,870 6,490 6,606 $6,636 $6,750 6,494 6,300 6,690 6,932 6,650 6,720 6,450 7,560 7,000 6,790 6,920 7,060 7,330 6,846 $6,833 Bristol Bunker Hill Cape Cod Greenfield Holyoke Mass Bay Massasoit Middlesex Mt. Wachusett North Shore Northern Essex Quinsigamond Roxbury Springfield CC Averages source: Department of Higher Education
Fee rates for the Massachusetts community college system from 2012 to 2021 College fees continue to be the reason why the cost of attending community colleges at Massachusetts has been soaring over the last decade. From spring 2020 to spring 2021, the fee rate at the colleges increased by 3% on average. The three colleges with the highest fees over that time period are respectively Roxbury, Bunker Hill, and Holyoke.
FY- 2012 FY- 2013 FY- 2014 FY- 2015 FY- 2016 FY- 2017 FY- 2018 FY- 2019 FY- 2020 FY- 2021 1 Yr % Chg Institution $5,030 4,484 3,510 4,370 5,238 3,700 4,580 4,350 4,610 5,290 4,320 3,960 5,420 4,130 4,356 $4,490 $4,500 $4,685 $4,921 $5,170 $5,372 $5,731 $5,896 $5,030 4,484 3,510 4,370 5,238 3,700 4,580 4,350 4,610 5,290 4,320 4,110 5,420 4,130 4,356 Berkshire $4,820 4,334 3,510 4,190 4,938 3,570 4,580 3,930 4,430 5,140 4,110 3,660 5,060 4,122 4,026 $5,030 $ 5,240 $5,420 $5,670 $5,970 $ 5,970 4,484 4,724 4,934 3,510 3,750 4,140 4,546 4,546 4,682 5,388 5,702 5,852 4,030 4,430 4,850 4,580 4,880 5,270 4,650 4,890 5,130 4,760 4,910 5,180 5,500 5,650 5,800 4,920 4,920 5,410 4,970 5,110 5,380 5,420 5,680 5,820 4,130 4,690 4,690 4,356 4,686 4,986 $ 5,970 5,774 5,580 5,970 6,152 5,930 6,000 5,730 6,840 6,250 6,040 6,170 6,340 6,550 6,096 0% 5,174 4,560 4,952 6,002 5,040 5,640 5,130 5,270 5,950 5,530 5,650 6,000 4,700 5,316 5,324 4,900 5,610 6,152 5,340 5,640 5,310 6,680 6,100 5,800 5,810 6,060 5,710 5,556 5,534 5,160 5,970 6,152 5,600 5,820 5,520 6,840 6,250 5,920 5,990 6,150 5,710 5,856 Bristol 4% Bunker Hill 8% Cape Cod 0% Greenfield 0% Holyoke 6% Mass Bay 3% Massasoit 4% Middlesex 0% Mt. Wachusett 0% North Shore 2% Northern Essex 3% Quinsigamond 3% Roxbury 15% Springfield 4% CC Average $4,295 $6,093 3% source: Department of Higher Education

 national trends")
 at Massachusetts")
 at Massachusetts")
 at Massachusetts")