University Enrollment Analysis for Fall 2022: Trends and Demographic Shifts

The analysis covers enrollment data for Fall 2022, depicting changes in enrollments, retention rates, student levels, race/ethnicity, gender, and financial levels. Key findings include declines in white and Hispanic student populations, with Asian and African American students also showing decreases. The data reflects shifts in gender enrollment and financial categories. Additionally, the Spring 2023 update highlights changes in FTES, resident FTES, headcount, and continuing rates compared to the previous year. Notably, retention rates vary across academic levels, with FTFT freshmen showing an increase.

Download Presentation

Please find below an Image/Link to download the presentation.
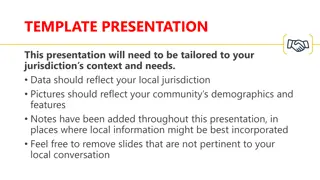
The content on the website is provided AS IS for your information and personal use only. It may not be sold, licensed, or shared on other websites without obtaining consent from the author. Download presentation by click this link. If you encounter any issues during the download, it is possible that the publisher has removed the file from their server.
E N D
Presentation Transcript
ENROLLMENTS 25500 25341 24946 25000 24500 24139 23939 (-1017) 24000 23500 23000 Fall 2019 Fall 2020 Fall 2021 Fall 2022
Retention Rate (Fall to Fall) 2018 to 2019: 83.2% of 19484 retained (=16213) 2019 to 2020: +1.7% (84.9% of 18,463) 15,684 retained (-529) 2020 to 2021: -4.1% (80.8% of 19,876) 16,065 retained (+381) 2021 to 2022: -1.1% (79.7% of 19,335) 15,413 retained (-652)
Change in Enrollment by Student Level 1400 1200 1000 800 600 400 200 0 -29 -111 -200 -186 -186 -400 -505 -600 Fall 2020 Fall 2021 Fall 2022 1-Freshman 2-Sophomore 3-Junior 4-Senior 5-Graduate/PB
Change in Enrollment by Race/Ethnicity 1500 1202 1124 1000 500 85 87 70 66 (7.3%) 49 8 5 0 -8 -82-38 -1 -36 (-5%) -16 (-19%) -8 -22-51 (-20%) -51 -114 (-7.6%) -169 (-5.5%) -156 -193 -395 -358 (-2.5%) -401 (-9%) -500 -1000 -1017 (-4%) -1500 Fall 2020 Fall 2021 Fall 2022 Grand Total African American American Indian Asian Hispanic Non-Resident Alien Other/ Unknown Pacific Islander White
The largest decrease in numbers and percentage was among white student population (-330, -9%). Second in numbers was among Hispanic students (-314, -2.5%). Asian students declined in a greater percentage than Hispanic students (-150, -5.5%). African American Students declined at a similar rate as Asian students (-35, -5.5%). Native American Students declined at the highest percentage (-14, -20%). Pacific Islander Students declined at the second highest percentage (-5, -15.2%).
Change in Enrollment by Gender 1000 818 800 600 379 400 200 5 -147 -260 12 -804 -225 12 0 -200 -400 -600 -800 -1000 Fall 2020 Fall 2021 Fall 2022 Female Male Others
Enrollment Change by Financial Level 1500 1202 1000 665 500 195 0 -17 -36 -395 -500 -518 -921 -1000 -1017 -1500 Fall 2020 Fall 2021 Fall 2022 0 - 23,999 >60,000 Grand Total 24,000 - 35,999 36,000 - 47,999 48,000 - 59,999 NO RESPONSE
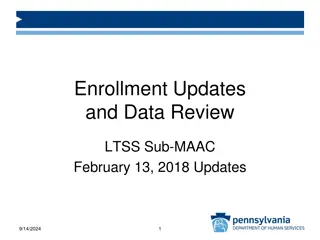
Spring 2023 As of Monday 11/29/2022, compared to last year at this time: FTES is -483 (16091) Resident FTES is -516 (15,660) HC is -896 (18,984) Continuing rate is -0.4% (76.6%) Higher for Freshman (0.4%), Sophomores (0.5%), and Juniors (0.5%) Lower for Seniors (-0.4%) and Graduate (-4.0%) FTFT freshmen retention is +1.7% (93.5%) FTFT transfers retention is -0.4% (89%)
Fall 2022 and Fall 2023 Applications (11/30/2021 vs. 11/30/2022) Type Fall 2022 Fall 2023 (Nov 30, 2022) (Nov 30, 2021) First-Time Freshman 11,336 15,205 (+34%) Transfer 3,598 4,158 (+16%) Total 14,934 19,363 (+30%)

")