Fall 2021 Student Enrollment Highlights and Financial Aid Overview
The Fall 2021 student enrollment update provides detailed insights into the demographics of new students, including first-year and transfer students at Storrs, regional campuses, and overall. The data includes information on ethnic and racial diversity, residency, financial aid distribution, and enrollment numbers compared to previous years. Additionally, it highlights key figures related to Federal Pell Grant recipients, first-generation students, and honors students. The accompanying financial aid highlights outline the percentages of students receiving aid and grants over the past four years. The comprehensive enrollment summary sheds light on undergraduate numbers and targets for Fall 2021 across various categories.

Download Presentation

Please find below an Image/Link to download the presentation.
The content on the website is provided AS IS for your information and personal use only. It may not be sold, licensed, or shared on other websites without obtaining consent from the author. Download presentation by click this link. If you encounter any issues during the download, it is possible that the publisher has removed the file from their server.
E N D
Presentation Transcript
Preliminary New Student Enrollment Update Fall 2021 1
Fall 2021 Highlights Storrs First Year: 3,695 More than 110 International First Years at Chinese Partners of First Year Students are Ethnic & Racial Minorities 46% 59.4% CT Residents 0.1% American Indian or Alaska Native 14% Asian 25% Federal Pell Recipients 8% Black 19.3% Hispanic or LatinX .03% Hawaiian or Pacific Islander 30 ACT More than 1 in 4 First Generation 554 Honors Students 1316 SAT 57.3% White Individual percentages add to greater than 46%, because a growing number of students identify with multiple races or ethnicities. Preliminary Data 2
Fall 2021 Highlights Regional First Year: 1,800 of First Year Students are Ethnic & Racial Minorities 57.6% 48% Federal Pell Recipients 93% CT Residents 0.11% American Indian or Alaska Native 13.7% Asian 13.4% Black More than 1 in 2 First Generation 25.1% Hispanic or LatinX 0% Hawaiian or Pacific Islander 34 Stamford Honors Students 1127 SAT 41.5% White Individual percentages add to greater than 57.6%, because a growing number of students identify with multiple races or ethnicities. Preliminary Data 3
Fall 2021 Highlights Transfer Students: 869 657 Transfers at Storrs 212 Transfers at the regional campuses Transfers from 263 colleges & universities (Including all 12 Connecticut Community Colleges) 82% are Connecticut residents; 18% nonresidents 33% are Federal Pell Grant Recipients Preliminary Data 4
New Student Financial Aid Highlights Fall 2018 Fall 2019 Fall 2020 Fall 2021 Difference New First Years receiving Federal Pell Grant 28% 33% 32% -1% 29% New First Years receiving some form of financial aid (loans, grants, scholarships, etc.) 75% 87% 87% 0% 84% New Transfers receiving Federal Pell Grant 33% 30% 34% 33% -1% New Transfers receiving some form of financial aid (loans, grants, scholarships, etc.) 76% 74% 75% 74% -1% Preliminary Data
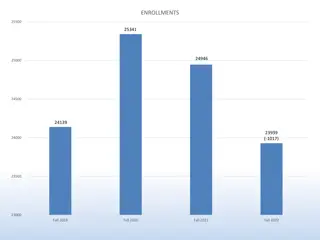
Fall 2021 Enrollment Summary Fall 2020 Actual Fall 2021 Target Fall 2021 Actual Storrs First Year 3,825 3,675 3,695 Storrs Transfers 748 750 657 Regional First Year 1,795 1,800 1,599 Storrs Spring Admission 226 175 205 Regional Transfers 247 200 212 Total New Students 6,841 6,425 6,368 Fall 2019 Fall 2020 Fall 2021 Total Undergraduates* 23,430 23,952 23,467 Preliminary Data * Degree Seeking Only 6
Questions? Nathan Fuerst, Vice President Division of Enrollment Planning & Management nathan.fuerst@uconn.edu 486-1463 Fall 2022 Class https://admissions.uconn.edu/ 7
Supplemental Tables First Year Application Trends Storrs First Year Enrollment Detail Storrs First Year by Ethnicity/Race Storrs First Year by Schools & Colleges Regional First Year Overall Regional First Year by Campus Regional First Year by Ethnicity/Race Storrs Spring Admission Cohort New Transfers Enrollment Definitions 8
First Year Application Trends Fall 2017 Fall 2018 Fall 2019 Fall 2020 Fall 2021 Storrs 34,198 34,885 35,079 34,434 36,751 Avery Point 224 230 199 206 199 Hartford 322 358 362 360 357 Stamford 1,896 2,317 1,139 1,293 1,374 Waterbury 256 239 245 256 246 All Campuses 36,896 38,029 37,041 36,549 38,927 Preliminary Data
Storrs First Year Enrollment Detail Fall 2017 Fall 2018 Fall 2019 Fall 2020 Fall 2021 Enrollees 3,683 3,749 3,603 3,825 3,695 Mean New SAT 1294 1306 1296 1281 1316 ACT 28.7 28.6 28.9 28.9 29.7 % URM 18.8% 24.4% 24.2% 25.3% 27.5% % Minority 35.1% 39.7% 41.2% 44.4% 46.0% % In State 64.5% 64.3% 66.2% 60.0% 59.4% % Out of State 21.5% 22.7% 21.2% 27.9% 34.1% % International 14.0% 13.0% 12.6% 12.1% 6.5% Honors Students 547 555 582 579 554 Preliminary Data URM = Underrepresented Minority
Storrs First Year by Ethnicity/Race* Fall 2017 Fall 2018 Fall 2019 Fall 2020 Fall 2021 Am Indian/ Alaska Native Black / African American 0.1% 0.2% 0.1% 0.0% 0.1% 6.8% 8.0% 7.5% 7.5% 8.0% 0.1% 0.0% 0.1 0.0% 0.03% Hawaiian / Pac Islander 11.8% 16.2% 16.5% 17.8% 19.3% Hispanic/ Latino 18.8% 24.4% 24.2% 25.3% 27.5% URM Subtotal 12.1% 11.8% 13.1% 14.3% 14.0% Asian 4.2% 3.5% 4.0% 4.8% 4.6% 2 or More 35.1% 39.7% 41.2% 44.4% 46.0% Minority Subtotal 2.7% 2.5% 2.8% 0.4% 0.3% Unknown 62.2% 57.7% 56.0% 55.2% 53.5% White * Percentages exclude international students URM = Underrepresented Minority Preliminary Data
Storrs First Year Schools & Colleges Fall 2020 Actual Fall 2021 Target Fall 2021 Actual By School and College ACES 723 705 690 CAHNR 272 260 297 Business 485 495 459 CLAS 1240 1100 1224 Engineering Business 17 15 13 Engineering 713 720 692 Fine Arts 126 160 104 Nursing 123 100 99 Pharmacy 84 80 83 RHAG Grand Total 42 40 34 3,825 3675 3695 Preliminary Data
Regional First Year Overall Fall 2017 Fall 2018 Fall 2019 Fall 2020 Fall 2021 1,609 1,806 1,738 2,021 1,804 Enrollees* 1092 1107 1113 1082 1128 Mean SAT 37.8% 36.5% 34.1% 39.7% 38.6% % URM 55.0% 56.3% 53.8% 58.9% 57.7% % Minority * Includes Storrs Spring Admission Students, which began Fall 2017 URM = Underrepresented Minority Preliminary Data
Regional First Year by Campus (Excludes Storrs Spring Admits) Fall 2020 Actual Fall 2021 Target Fall 2021 Actual Avery Point 179 200 194 Hartford 578 550 531 Stamford 738 650 629 Waterbury 300 225 246 TOTAL 1,795 1,625 1,599 Preliminary Data
Regional First Year by Ethnicity/Race* Fall 2017 Fall 2018 Fall 2019 Fall 2020 Fall 2021 0.1% 0.1% 0.2% 0.1% 0.1% Am Indian/ Alaska Native 13.9% 12.8% 11.6% 13.7% 13.4% Black / African American 0.0% 0.0% 0.0% 0.0% 0.0% Hawaiian / Pac Islander 23.8% 23.6% 22.3% 26.0% 25.1% Hispanic/ Latino 37.8% 36.5% 34.1% 39.7% 38.6% URM Subtotal 13.0% 15.5% 15.7% 13.9% 13.7% Asian 4.3% 4.3% 4.0% 5.3% 5.4% 2 or More 55.1% 56.3% 53.8% 58.9% 57.7% Minority Subtotal 1.5% 1.1% 1.4% 0.3% 1.0% Unknown 43.4% 42.6% 44.8% 41.1% 41.4% White * Percentages exclude international students URM = Underrepresented Minority Preliminary Data
Storrs Spring Admission Cohort Fall 2018 Fall 2019 Fall 2020 Fall 2021 Avery Point 25 10 40 12 Hartford 93 68 88 39 Stamford 27 25 43 126 Waterbury 29 18 55 29 TOTAL 174 121 226 205 Preliminary Data
New Transfers Enrollment Fall 2017 Fall 2018 Fall 2019 Fall 2020 Fall 2021 Storrs 851 764 735 748 657 Regionals 261 207 216 247 212 Total 1,112 971 951 995 869 Preliminary Data
Definitions First Generation Student a student for whom neither parent/guardian has earned a bachelors degree or higher. Determination based on student responses on the application for admissions Minority Student Includes students who indicate ethnicity/race of either Hispanic/LatinX, Asian, American Indian/Alaska Native, Black/African American, Native Hawaiian or Other Pacific Islander or Two or More. Underrepresented Minority (URM) Student Includes students who indicate ethnicity/race of either Hispanic/LatinX, American Indian/Alaska Native, Black/African American or Native Hawaiian or Other Pacific Islander. Storrs Spring Admission these are students in the entering first year cohort at the regional campuses who spend their first term at the regional campus, and move to Storrs for their spring term, having met certain conditions (e.g. minimum GPA) 18