Medicare Prescription & Outpatient Drugs Data Analysis October 2022

Enrollment in Medicare stand-alone prescription drug plans slightly declined between 2020 and 2021. The rates of enrollment vary between rural and urban states, with higher enrollment in rural states with low Medicare Advantage rates. Across counties, enrollment in prescription drug plans ranges from less than 1% to 78% of Medicare beneficiaries. The average number of stand-alone prescription drug plans decreased by almost one-quarter between 2021 and 2022. The average premium for stand-alone prescription drug plans in 2022 is $48 per month.

Download Presentation

Please find below an Image/Link to download the presentation.
The content on the website is provided AS IS for your information and personal use only. It may not be sold, licensed, or shared on other websites without obtaining consent from the author. Download presentation by click this link. If you encounter any issues during the download, it is possible that the publisher has removed the file from their server.
E N D
Presentation Transcript
MEDICARE DATA HUB Prescription & Outpatient Drugs October 2022
PRESCRIPTION & OUTPATIENT DRUGS: ENROLLMENT Enrollment in Medicare stand-alone prescription drug plans dropped slightly between 2020 and 2021. Prescription Drug Plan (PDP) Enrollment in Millions 25.6 25.5 25.2 25.1 24.7 24.3 24.0 23.3 22.5 19.7 18.6 17.7 44% 44% 44% 44% 44% 44% Percent of All Medicare Beneficiaries 43% 41% 40% 39% 39% 38% 2010 2011 2012 2013 2014 2015 2016 2017 2018 2019 2020 2021 Source: CMS PDP State/County Penetration File, March 2021. Note: Enrollment estimates do not include records denoted as pending state or county designation. This file contains data for the following organization types (where there are active contracts): PDP; employer/union-only direct-contract PDP. 2
PRESCRIPTION & OUTPATIENT DRUGS: ENROLLMENT Rates of enrollment in Medicare stand-alone prescription drug plans (PDPs) is highest in rural states with low Medicare Advantage enrollment rates. Enrolled in PDP Plan (%) Medicare Beneficiaries 60% 40% 20% 0% WY WV WA MO NM MD MN CO OH OR MA MS ME ND NH DC NC OK GA MT SD AR SC DE NE NY CA NV TN AK KS KY VA PA CT UT TX VT AZ LA WI AL NJ FL MI IN ID RI HI IA IL 0 PDP Enrollment in Thousands 1,000 2,000 National % enrolled in PDP Plan: 38.7% National PDP enrollment: Approx. 24.3 million 3,000 3 Source: CMS Monthly Enrollment by State, March 2021.
PRESCRIPTION & OUTPATIENT DRUGS: ENROLLMENT Across counties, enrollment in stand-alone prescription drug plans (PDPs) ranges from less than 1 percent to 78 percent of Medicare beneficiaries. <1% 34% 35% 49% 50% 64% 65% 90% No PDP enrollment or missing data Source: CMS PDP State/County Penetration File, March 2021. Note: Enrollment estimates do not include records denoted as pending state or county designation. 4
PRESCRIPTION & OUTPATIENT DRUGS: AVAILABILITY Between 2021 and 2022, the average number of stand- alone prescription drug plans fell by almost one-quarter. Average number of prescription drug plans 50 47 40 33 30 31 30 28 28 28 27 26 24 23 23 20 20 10 0 2010 2011 2012 2013 2014 2015 2016 2017 2018 2019 2020 2021 2022 Source: CMS State/County Penetration, and PDP Landscape Source Files, 2010 2022. Note: Data represent the average number of plans operating in counties across the U.S., weighted by the number of Medicare beneficiaries in each year. (Data for 2021 are weighted by September 2020 beneficiaries.) Employer- sponsored plans and plans under sanction are excluded. Estimates do not include records denoted as pending state or county designation. 5
PRESCRIPTION & OUTPATIENT DRUGS: BENEFITS Average premiums for stand-alone prescription drug plans (PDP) in 2022 are $48 per month, on average. Range Minimum $ Mean $ Maximum $ $6 $48 $207 All Stand-Alone PDPs $22 $45 $116 PDP-Basic $6 $50 $207 PDP-Enhanced 0 50 100 150 200 250 Dollars ($) Source: CMS Plan and Premium Information for Plans Offering Part D Coverage, 2022. Notes: Amounts represent total Part D premiums, which are the sum of the Basic and Supplemental Premiums. Total premium may be lower than the sum of the basic and supplemental premiums because of negative basic or supplemental premiums. MA-PD average excludes employer-sponsored plans, Part B only plans, demonstration, cost plans, and plans not offering Part D benefits. 6
PRESCRIPTION & OUTPATIENT DRUGS: BENEFITS Between 2021 and 2022, premiums for Part D stand-alone prescription drug plans increased by 16 percent. Weighted by plan enrollment Dollars ($) 50 $44 40 $41 $41 $40 $39 $39 $38 $38 $38 $38 $38 $37 30 20 10 0 2011 2012 2013 2014 2015 2016 2017 2018 2019 2020 2021 2022 Source: CMS Plan and Premium Information for Plans Offering Part D Coverage, 2011 2022. Notes: Data represent average plan premiums weighted by plan enrollment and are not adjusted for inflation. Amounts represent total Part D premiums, which are the sum of the basic and supplemental premiums. Total premium may be lower than the sum of the basic and supplemental premiums because of negative basic or supplemental premiums. Employer-sponsored plans and plans under sanction are excluded. 7
PRESCRIPTION & OUTPATIENT DRUGS: LOW INCOME SUBSIDY Beginning in 2021, more beneficiaries receiving a Part D low-income subsidy (LIS) are in Medicare Advantage plans than stand-alone prescription drug plans. MA-PD LIS Enrollment PDP LIS Enrollment Total LIS Enrollment Enrollment in millions 15 12 9 8.3 8.3 8.3 8.3 8.0 8.0 8.0 7.8 7.6 7.3 6.8 6.7 6 6.1 6.0 5.4 4.9 4.4 4.0 3.7 3 3.2 2.8 2.5 2.2 1.9 0 2010 2011 2012 2013 2014 2015 2016 2017 2018 2019 2020 2021 MA-PD = Medicare Advantage prescription drug plan; PDP = Stand-alone prescription drug plan. Source: CMS Low Income Subsidy Enrollment by Plan, 2010-2021. Note: Enrollment estimates do not include plan records suppressed because of a value of 10 or less. Only includes Medicare Advantage plans with Part D coverage. 8
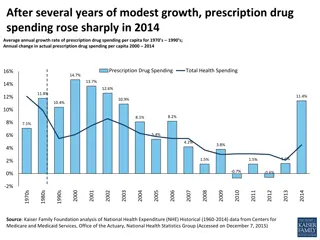
PRESCRIPTION & OUTPATIENT DRUGS: SPENDING Between 2019 and 2021, drug spending in Medicare Part D rose twice as fast as drug spending in Part B. Change, 2019 2021: Change, 2019 2021: +10% Part B Drug Spending Per Capita Part D Drug Spending Per Capita +5% $600 $4,500 $580 $585 $560 $569 $4,000 $4,179 $559 $3,967 $540 $3,786 $3,500 $520 $3,000 $500 $480 $2,500 $460 $2,000 $440 $1,500 $420 $400 $1,000 2019 2020 2021 2019 2020 2021 Data: Analysis of Medicare claims data for 2019 to 2021. Note: Part B spending (for drugs provided in doctors offices and hospital outpatient departments) only includes beneficiaries in traditional Medicare. Part D spending (for retail prescription drugs) includes all Medicare beneficiaries enrolled in Part D, including those in Medicare Advantage plans. 9
PRESCRIPTION & OUTPATIENT DRUGS: SPENDING Medicare Part D drug spending among people dually eligible for Medicare and Medicaid increased by 16 percent from 2019 to 2021. Change, 2019 2021: $ billions +16% $100 $90 $90.8 $80 $82.9 $78.1 $70 $60 $50 $40 $30 $20 $10 $0 2019 2020 2021 Data: Analysis of Medicare claims data for 2019 to 2021. Part D spending includes all Medicare beneficiaries with Part D (including those in Medicare Advantage plans). 10
PRESCRIPTION & OUTPATIENT DRUGS: SPENDING Five drugs accounted for 40 percent of Part B drug spending in 2021, while the top five drugs comprised only 15 percent of Part D spending. 2.73% 2.42% 5.83% 2.18% 1.88% 16.61% Aflibercept, 1 mg Eliquis Pembrolizumab, 1 mg Revlimid 8.27% Denosumab, 1 mg Xarelto Part B Part D Ranibizumab, 0.1 mg Trulicity 5.69% 60% Abatacept, 10 mg* Januvia 5.21% All other drugs All other drugs 85% 3.96% Total Medicare Part B drug spending in traditional Medicare, 2021: $20 billion Total Medicare Part D drug spending, 2021: $216 billion Notes: Top five Part B drugs are all administered as injections. Part D drugs are listed by brand name. * Administered under the direct supervision of a physician. Data: Analysis of Medicare claims data. Part B spending only includes beneficiaries in traditional Medicare. Part D spending includes all Medicare beneficiaries with Part D, including those in Medicare Advantage plans. 11
PRESCRIPTION & OUTPATIENT DRUGS: SPENDING Treatments for hypertension and mental health conditions accounted for nearly half of Medicare Part B and Part D drug spending in 2021. Distribution of Medicare Part B and Part D Drug Spending, by Condition, 2021 0.36% 1.69% 3.79% 3.49% 7.39% Hypertension 6.82% 25.08% Chronic Kidney Disease 29.79% 6.60% 12.76% Mental Health/Substance Abuse Diabetes Part B Part D Cancer 18.08% 13.51% COPD 16.77% Asthma 16.20% HIV/AIDS 16.19% 21.47% Total Medicare Part B drug spending in traditional Medicare, 2021: $20 billion Total Medicare Part D drug spending, 2021: $216 billion Data: Analysis of Medicare claims data. Note: Part B drug spending amount is calculated from the total amount of allowed charges for the line-item service on a noninstitutional claim in traditional Medicare. This charge is used to compute pay to providers or reimbursement to beneficiaries. Data on Part B drug spending by Medicare Advantage enrollees is not available. Part D drug spending is calculated from the total cost of a prescription drug event, the sum of the ingredient cost, dispensing fee, sales tax (if any), and vaccine administration fee (if any); it includes spending for beneficiaries in traditional Medicare and Medicare Advantage enrollees. 12
PRESCRIPTION & OUTPATIENT DRUGS: SPENDING Five pharmacy chains accounted for 45 percent of all Medicare Part D spending in 2021. 15% CVS Health 12% Walgreens Medicare Part D spending, by pharmacy chain, 2021 Elevate Provider Network 55% Health Mart Atlas 6% Cardinal Health Other Companies 6% 6% Data: Analysis of Medicare Part D data, including Part D enrollees in traditional Medicare and Medicare Advantage plans. Data include both pharmacy provided and mail-order prescriptions. 13