ETSU Fall 2014 Enrollment Projections Analysis
The ETSU Fall 2014 Enrollment Projections Analysis conducted by Mike Hoff, Director of Institutional Research, utilized a Markov chain model to estimate enrollment. The goal was to reach 15,500 enrollments, with data informing college-level improvement plans. Assumptions included stable recruitment and retention patterns, particularly in Medicine and Pharmacy programs. The Markov chain model, chosen for its accuracy in one-year projections, tracked student progression and provided insights for enrollment planning.

Download Presentation

Please find below an Image/Link to download the presentation.
The content on the website is provided AS IS for your information and personal use only. It may not be sold, licensed, or shared on other websites without obtaining consent from the author. Download presentation by click this link. If you encounter any issues during the download, it is possible that the publisher has removed the file from their server.
E N D
Presentation Transcript
ETSU Fall 2014 Enrollment Projections Markov chain Analysis Mike Hoff, Director Institutional Research 10.31.2013
Enrollment projection goal To estimate the ETSU Fall 2014 Enrollment Use a model that allows for testing recruitment and retention scenarios The results will be used to determine how far from goal, 15,500, ETSU appears to be To provide data which will inform defining college level enrollment improvement plans
Assumptions Assuming a consistent external environment, and assuming that we make no changes to address recruitment and retention, the enrollment and progression patterns of students by class from year1to year2will remain stable This allows for testing enrollment improvement plans because the variable impact is real and measurable Medicine and Pharmacy Enrollment is approximately stable and recognized as a known quantity
Assumptions continued First-time and continuing freshmen can be combined as a total freshmen count Masters students, graduate specials, and ed specials can be combined as a total for projection only, but may be divided for goal setting
Model Markov chain Is a time-series model that looks at past practice to predict future outcome For enrollment modeling, Markov chain tracks students, by status, from year1to year2 allowing the researcher to calculate an recruitment rate and dropout rate by class The recruitment and retention rates are applied to the current standing of year2to students, adding in new inputs by class for year2, to calculate enrollment for year3
Model continued Markov chain was chosen because It is used by other similar institutions, both in- state, and out-of-state It uses only institutional data Studies have shown it is accurate for 1 year projections Population based models were rejected due to reliance on external projections ARIMA and other SAS projections were rejected because of complexity without increased accuracy
Timeframe Data were collected by year for the years 2008 2013, These years were used to establish a validity test to understand the margin of error in the model 2008 was the first year in Banner The data were then paired by year into two year groups to allow for projecting the next years enrollment i.e. 2008 and 2009 were used to project 2010, etc.
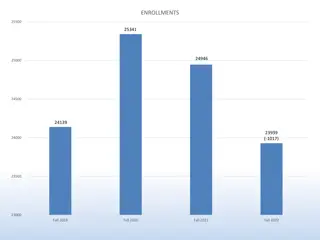
2014 Projected enrollment results of replicating the status quo Estimate Projected by Model Year Actual Difference % Difference 2010 14,860.3 14,952 -91.7 -0.617% 2011 15,188.2 15,250 -61.8 -0.406% 2012 15,428.8 15,133 295.8 1.917% 2013 14,967.2 14,691 276.2 1.845% 2014 14,430 N/A N/A N/A The projection for each year is a function of the actual enrollments from the two most recent prior years
Credibility: Is there a margin of error? Yes, a very slim one, on average +/- 1.196% That yields a projected enrollment range of 14,257 14,603 In other words, the model was, based on 4-years history, 98.8% accurate
WHAT HAPPENED TO ALL OUR STUDENTS?
What happened to all our students? 39% are leaving, either through graduation or dropout 19% are graduating 20% are leaving through dropout
WHO ARE THE UNDERGRADUATE DROPOUTS?
Who are the undergraduate dropouts UG Spec % of Total College Freshmen Sophomore Junior Senior Total ND 277 277 10.1% UD 284 63 19 1 367 13.4% AS 360 155 151 175 841 30.7% BT 199 76 70 94 439 16.0% CR 94 30 27 21 172 6.3% CS 12 15 33 52 112 4.1% ED 77 49 51 40 217 7.9% NU 111 43 30 50 234 8.5% PU 31 13 14 24 82 3.0% Total 1,168 444 395 457 277 2,741 100%
Who are the undergraduate dropouts (Exclude UD & ND) % of Total College Freshmen Sophomore Junior Senior Total AS 360 155 151 175 841 40.1% BT 199 76 70 94 439 20.9% CR 94 30 27 21 172 8.2% CS 12 15 33 52 112 5.3% ED 77 49 51 40 217 10.4% NU 111 43 30 50 234 11.2% PU 31 13 14 24 82 3.9% Total 884 381 376 456 2,097 100%
Undergraduate data points of note 1,100 of the 3,212 New and Continuing Freshmen dropout or stop out Sophomore Enrollment is break-even, new & returning students are almost equal to dropouts Large Senior population leaving before graduation
WHO ARE THE GRADUATE DROPOUTS?
Who are the graduate dropouts % of Total College Master Grad Special Doctor Total ND 97 97 29.5% AS 44 4 2 50 15.2% BT 19 1 20 6.0% CR 5 5 10 3.0% CS 12 3 15 4.6% ED 54 7 16 77 23.4% GS 1 1 0.3% ME 2 2 0.6% NU 25 9 7 41 12.5% PU 9 4 3 16 4.9% Total 169 125 35 329 100%
Who are the graduate dropouts College Master Doctor Total % of Total AS 44 2 46 22.5% BT 19 19 9.3% CR 5 5 10 4.9% CS 12 12 5.9% ED 54 16 70 34.3% GS 1 1 0.5% ME 2 2 1.0% NU 25 7 32 15.7% PU 9 3 12 5.9% Total 169 35 204 100%
WHAT DOES IT ALL MEAN? Who needs to be involved? THE BUC STOPS HERE! Student recruitment and retention is everyone's responsibility
Who does it involve? Actions by offices such as these
The Role of Colleges, Departments, and Programs Recruitment Retention
What must we do For ETSU to reach the 15,500 goal we must increase recruitment by 8% and retention by 6.5% or some combination yielding at least 1,070 students An 8% increase in recruitment is 440 students A 6.5% increase in retention equals 630 students
Everyone recruits! Recruitment Goal Category Weight Freshmen 38% 167 Sophomore 14% 62 Junior 13% 57 Senior 15% 66 Undergraduate Special 9% 40 Masters 10% 44 Doctoral 1% 4 Total 100% 440
Recruitment goals by college College Weight Recruitment Goal AS 35% 154 BT 19% 84 CR 8% 35 CS 4% 17 ED 17% 75 NU 13% 57 PU 4% 18 Total 100% 440
Retention is not just a freshmen problem! Category Retention Goal Dropout % of Dropout Freshmen 239 1168 20.5% Sophomore 88 444 19.8% Junior 82 395 20.8% Senior 95 457 20.8% Undergraduate Special 57 277 20.6% Masters 63 294 21.4% Doctoral 6 35 17.1% Total 630 3070 20.5%
Retention goals by student level Retention Goal Category Weight Freshmen 38% 239 Sophomore 14% 88 Junior 13% 82 Senior 15% 95 Undergraduate Special 9% 57 Masters 10% 63 Doctoral 1% 6 Total 100% 630
Retention goals by college College Weight Retention Goal AS 35% 220 BT 19% 121 CR 8% 50 CS 4% 25 ED 17% 107 NU 13% 82 PU 4% 25 Total 100% 630
COLLEGE LEVEL RECRUITMENT AND RETENTION GOALS
Overall recruitment and retention goals by college Recruitment Increase Retention Increase Total Increase College Weight AS 35% 154 220 374 BT 19% 84 121 205 CR 8% 35 50 85 CS 4% 17 25 42 ED 17% 75 107 182 NU 13% 57 82 139 PU 4% 18 25 43 Total 100% 440 630 1,070
What is my part of the pie? We created the breakdown by college to ensure that as we grow we maintain the proportional distribution of students These goals will be achieved through a mix of college level and university level activities The goal today is to identify what is the most reasonable distribution of that responsibility
Recruitment: Working Hypothesis Why are students coming? Undergraduate A majority of the work is being done by offices charged with carrying out that function effectively Smaller share of the work is being carried out by colleges departments Graduate Colleges, departments, programs, and faculty play a more direct role in recruitment
Retention: Working Hypothesis Why are students staying? Undergraduate A majority of the work is being carried out by colleges, departments, programs and faculty Smaller share of the work done by offices charged with carrying out that function effectively Graduate An even larger majority of the work is being carried out by colleges, departments, programs, and faculty
Options Status Quo Keep doing the same thing and assume things will work out Change Use data to develop a plan to have a positive impact on student retention, and enrollment
Results of the status quo Absent a well executed, and successful, enrollment improvement plan ETSU s enrollment in Fall 2014 is projected to be 14,430 1,070 students short of 15,500 goal Status Quo means falling behind
Final reflections on the status quo Model was 98% accurate over the past 4 years Model shows we are down, to-goal, 1,070 students Reaching the goal is best achieved through a combination of Recruitment and Retention
Your Goal: Discuss College Level Enrollment Improvement Plans
Request: Present a plan in which you believe! Plans: Must be college specific Must be focused on the proportional share of enrollment improvement, using the framework of the working hypothesis Must be transparent in depicting college engagement for bona fide improvement tactics Will be assessed using the overall enrollment goals presented Each plan must clearly and convincingly make the case for achieving a defined percentage of the college recruitment and retention goals Must include both recruitment and retention initiatives Will be used to evaluate, by college, positions requested pending available funds Should depict college assessment of risk
Dont limit your plan Consider Pedagogy & Delivery Systems Curriculum Bridge Courses New Markets (International & Domestic) New Collaborations Alternative Schedules & Calendars New Partnerships New Student Populations With distinctive career goals Students who cannot come to main campus (ex. E-Learning, International, Out-of-state, etc.) Trade impacted workers Service to others
Recruitment Responsibility What responsibility for recruitment should reasonably reside with Individual College, Academic Department, Program, and Faculty Administrative and Academic Support functions (e.g. undergraduate admissions, graduate school, financial aid, scholarships, bursar, registrar, etc.) and any other office with significant customer service responsibility
Retention Responsibility What responsibility for retention should reasonably reside with Individual College, Academic Department, Program, and Faculty Administrative and Academic Support functions (e.g. undergraduate admissions, graduate school, financial aid, scholarships, bursar, registrar, etc.) and any other office with significant customer service responsibility
STUDENT SUCCESS THROUGH FOCUSED RECRUITMENT AND RETENTION ENROLLMENT PLANNING