Sketching Graphs of Functions: Techniques and Examples
The art of sketching graphs of functions involves representing specific shapes and behaviors through labeled diagrams. This lesson highlights key details to keep in mind when sketching functions, such as labeling axes, maximum and minimum values, intercepts, symmetry, and asymptotes. Two examples of sketching functions, including a parabola and a quadratic function, are explained step by step, demonstrating how to find key points like intercepts, line of symmetry, and vertex to accurately depict the function's graph.

Download Presentation

Please find below an Image/Link to download the presentation.
The content on the website is provided AS IS for your information and personal use only. It may not be sold, licensed, or shared on other websites without obtaining consent from the author. Download presentation by click this link. If you encounter any issues during the download, it is possible that the publisher has removed the file from their server.
E N D
Presentation Transcript
6 October 2024 Creating the sketch of a function LO: To create the sketch of a function from information given or transferring a graph from screen to paper. www.mathssupport.org
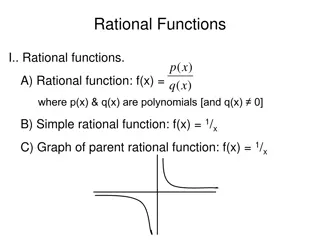
Sketching the graph of a function Every function has a particular behaviour and is identified by a specific shape. There are two ways to represent the graph of a function. Drawing its graph. Sketching its graph. In this lesson we will be working on Sketching the graph of a function If you are asked to sketch the graph of a function is to represent by means of a diagram or graph (labelled as appropriate). The sketch should give a general idea of the required shape or relationship and should include relevant features. www.mathssupport.org
Sketching the graph of a function Details to keep in mind when sketching a function. All axes should be labelled. Features that should be labelled: Any maximum value Any minimum value Axis intercepts Axis of symmetry Zeros of functions or roots of equations Equations of vertical and horizontal asymptotes Identify starting and ending points www.mathssupport.org
Sketching the graph of a function Sketch the graph of the function y = x2 + 3x 10. We need some points to sketch the graph The graph is a parabola y From the equation we have the y-intercept. 7 6 5 4 y-intercept (0, 10). 3 2 We can find the zeros of the function by factorizing the equation and these are the x-intercepts. 0 = x2 + 3x 10. (x + 5) (x 2) 0 = (x + 5) = 0 x = 5 These are the zeros of the function ( 5, 0). 1 (2, 0) x 0 -1 -10 1 2 3 4 5 6 7 9 10 -9 -8 -7 -6 -5 -4 -3 -2 8 -1 -2 -3 -4 -5 -6 -7 -8 (x 2) = 0 x = 2 -9 -10 (0, 10). -11 ( 5, 0) (2, 0) x-intercepts -12 -13 www.mathssupport.org
Sketching the graph of a function Sketch the graph of the function y = x2 + 3x 10. We need some points to sketch the graph The graph is a parabola y 7 Now we can calculate the equation of the line of symmetry. The line of symmetry is halfway between the x-intercepts. 6 x = -1.5 5 4 3 2 ( 5, 0). 1 (2, 0) x 0 -1 -10 1 2 3 4 5 6 7 9 10 -9 -8 -7 -6 -5 -4 -3 -2 8 -1 -2 Equation of the axis of symmetry p + q 2 This is the x-coordinate of the vertex Finding the y-coordinate -3 -4 -5 + 2 2 -1.5 x = = = -5 -6 -7 -8 -9 y = (-1.5)2 + 3(-1.5) 10 y = -12.25 (-1.5, -12.25) Vertex -10 (0, 10). -11 ( 1.25, 12.25). -12 -13 www.mathssupport.org
Sketching the graph of a function Sketch the graph of the function y = 2(x + 3)(x 1). We need some points to sketch the graph The graph is a parabola 2 3 1 y From the equation we have the y-intercept. () () 8 7 (0, 6). 6 5 4 y-intercept (0, 6). 3 2 We can find the zeros of the function by equating to zero the equation and these are the x-intercepts. 2(x + 3)(x 1) 0 = (x + 3) = 0 x = 3 1 ( 3, 0). (1 , 0) x -1 -3 -6 -5 0 -10 2 3 4 5 6 7 9 10 -9 -8 -7 -4 -2 8 1 -2 -3 -4 -5 -6 (x 1) = 0 -7 -8 x = 1 -9 -10 -11 x-intercepts (1, 0) ( 3, 0) -12 -13 www.mathssupport.org
Sketching the graph of a function Sketch the graph of the function y = -2(x + 3)(x 1). We need some points to sketch the graph The graph is a parabola y 8 Now we can calculate the equation of the line of symmetry. The line of symmetry is halfway between the x-intercepts. 7 (0, 6). 6 5 4 3 2 1 ( 3, 0). (1 , 0) x -1 -3 -6 -5 0 -10 2 3 4 5 6 7 9 10 -9 -8 -7 -4 -2 8 1 -2 Equation of the axis of symmetry p + q 2 This is the x-coordinate of the vertex Finding the y-coordinate -3 -3 + 1 2 -1 x = = = -4 -5 -6 -7 -8 -9 y = -2(-1+3)(-1 -1) y = 8 (-1, 8) Vertex -10 x = -1 -11 -12 -13 www.mathssupport.org
Sketching the graph of a function Use the GDC to sketch the graph of the function y = x3 x2 7x 1 for the domain 2 x 3 y 5 Turn on the GDC Press Y= 4 3 2 1 x 3 2 1 1 2 3 -1 -2 -3 -4 -5 --6 -7 -8 -9 -10 -11 www.mathssupport.org
Sketching the graph of a function Use the GDC to sketch the graph of the function y = x3 x2 7x 1 for the domain 2 x 3 y 5 Turn on the GDC Press Y= Type in the function y = x3 x2 7x 1 enter Press 4 3 2 1 x 3 2 1 1 2 3 -1 Graph -2 -3 -4 -5 --6 -7 -8 -9 -10 -11 www.mathssupport.org
Sketching the graph of a function Use the GDC to sketch the graph of the function y = x3 x2 7x 1 for the domain 2 x 3 y 5 Turn on the GDC Press 5 Type in the function y = x3 x2 7x 1 enter Press Press 4 Graph 3 2 1 x 3 2 1 1 2 3 -1 Graph Window -2 -3 -4 -5 --6 -7 -8 -9 -10 -11 www.mathssupport.org
Sketching the graph of a function Use the GDC to sketch the graph of the function y = x3 x2 7x 1 for the domain 2 x 3 y 5 Turn on the GDC Press 5 Type in the function y = x3 x2 7x 1 enter Press Press 4 Graph 3 2 1 x 3 2 1 1 2 3 -1 Graph Window -2 -3 Set the domain Xmin: 2 Xmax: 3 Set the range -4 enter enter -5 --6 -7 -8 -9 -10 -11 enter enter Ymin: 12 Ymax: 5 Press graph www.mathssupport.org
Sketching the graph of a function Use the GDC to sketch the graph of the function y = x3 x2 7x 1 for the domain 2 x 3 We need some points to sketch the graph y 5 (-1.2, 4.2) 4 3 2 Press 2nd Calc Press 4 maximum Drag the cursor to the left of a maximum enter Drag the cursor to the right of a maximum enter enter 1 x 3 2 1 1 2 3 -1 -2 -3 -4 -5 Maximum point: (-1.2, 4.2) Press 2nd Calc --6 -7 -8 -9 -10 -11 www.mathssupport.org
Sketching the graph of a function Use the GDC to sketch the graph of the function y = x3 x2 7x 1 for the domain 2 x 3 We need some points to sketch the graph y 5 (-1.2, 4.2) 4 3 2 Press 3 minimum Drag the cursor to the left of a minimum enter Drag the cursor to the right of a minimum enter enter 1 x 3 2 1 1 2 3 -1 -2 -3 -4 Minimum point: (1.9, -11.1) Press 2nd Calc -5 --6 -7 -8 -9 -10 -11 www.mathssupport.org (1.9, -11.1)
Sketching the graph of a function Use the GDC to sketch the graph of the function y = x3 x2 7x 1 for the domain 2 x 3 For the x-intercept: Press 2: zero Drag the cursor to the left of a zero enter Drag the cursor to the right of a zero enter enter y 5 (-1.2, 4.2) 4 3 2 (-2, 1) 1 x (-0.15, 0) 3 2 1 1 2 3 -1 -2 X-intercept: (-0.15, 0) Press 2nd Calc -3 -4 For the starting point: Press 1: value -5 --6 -7 -8 -9 -10 -11 enter x: 2 Starting point: (-2, 1) Press 2nd Calc www.mathssupport.org (1.9, -11.1)
Sketching the graph of a function Use the GDC to sketch the graph of the function y = x3 x2 7x 1 for the domain 2 x 3 For the ending point: Press 1: value y 5 (-1.2, 4.2) 4 3 2 enter x: 3 Ending point: (3, -4) Press 2nd Calc (-2, 1) 1 x (-0.15, 0) 3 2 1 1 2 3 (0, -1) -1 For the y-intercept: Press 1: value -2 -3 enter x: 0 Y-intercept: (0, -1) (3, -4) -4 -5 Join the points with a smooth curve --6 -7 -8 -9 -10 -11 www.mathssupport.org (1.9, -11.1)
Thank you for using resources from A close up of a cage Description automatically generated For more resources visit our website https://www.mathssupport.org If you have a special request, drop us an email info@mathssupport.org www.mathssupport.org