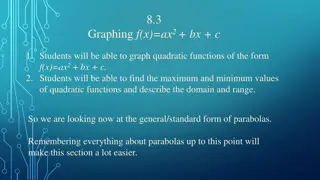
Understanding Functions and Graphing in Mathematics

Functions and graphing play a crucial role in quantitative and qualitative reasoning. We explore the concept of points on a graph, coordinates, relations, functions, and ways to express functions. Utilizing visual aids and analogies, we delve into the importance of coordinates, the distinction between relations and functions, and the versatility in presenting functions through points, tables, graphs, and equations.

Download Presentation

Please find below an Image/Link to download the presentation.
The content on the website is provided AS IS for your information and personal use only. It may not be sold, licensed, or shared on other websites without obtaining consent from the author. Download presentation by click this link. If you encounter any issues during the download, it is possible that the publisher has removed the file from their server.
E N D
Presentation Transcript
Functions and Graphing ID1050 Quantitative & Qualitative Reasoning
Points on a Graph and Coordinates We can describe all the points in a plane by laying out two number lines that cross each other. We call these number lines axes. The intersection of the two is called the origin. The horizontal one is usually called the x-axis, and the vertical is the y-axis. The scale and spacing can be the same or different between the axes. We notice that every point in the plane can be located by its value along the x-axis and its value along the y-axis. The x and y values put together in that order are called the coordinates of the point they represent. There is a one-to-one mapping of every point to two unique coordinates. Coordinates are always in order (x,y). y (1,2) 2 x 1
Relations and Functions A Relation is a collection of points (or their coordinates) that are related in some way. A Function is a relation that follows this rule: No two unique coordinates have the same first number (x-value) A function can consist of discrete points or a continuous set of points. A function can be a finite or an infinite number of points.
Battleship Example y In the game of Battleship, ships are placed on a grid, and guessing the points underneath them is the goal of the game. Ship 1 s points (5,3), (5,4), and (5,5) are a relation, but not a function: The three unique points share the same first number. Essentially, functions can t have points on the same vertical line. Ship 2 s points (1,2), (2,2), (3,2), and (4,2) are a relation and also a function. If every point between (1,2) and (4,2) are also included, then: x is continuous, and y is discrete. Points are specified by: 1 x 4 and y=2. 5 4 3 2 1 x 1 2 3 4 5
Function Gun Analogy Functions take a number, perform an operation on it, and return another number. One way to understand how a function operates is visualize it as a function gun. The function gun can take any type of bullet (e.g. BB, .22 caliber, 9 mm, etc.) For each type of bullet, the function gun always hits the same point on the target. The bullet is the x-value, and the hole in the target is the y-value The rules of functions make them reversible. Observing the hole in the target, one can deduce the bullet that made it.
Ways to Express Functions Now we have several ways of expressing a function: We can simply list the points that the function relates: (x,y) If there are an infinite number of them, we can list a representative sample. We can instead list the points in table format. One column holds the x s, the other column holds the y s. We can draw the points on a graph If there are an infinite number of them, we can draw a few and connect the dots We can write the relationship between x and y as an equation. y is a function of x, written y = f (x) The function f takes an x value and turns it into a y value.
Graphing an Equation If a function in equation form is to be put into graphical form, the possible x-values must be provided. The possible x values are called the Domain The resulting possible y values are called the Range You can form a table of the x and y values . List the x-values (or a representative set of them) Use the equation to find the corresponding y values You can now sketch the axes. You need to wait until the table is formed to know where to start and end the axes. Now draw the points for each (x,y) pair, and then connect the dots. 5-20 points is usually enough to get an idea of the complete graph.
Graphing Example x x y y 0 0 1 Let s start with a simple example: y=2x+1 with 0 x 4 We need 5-20 points, so if we step the x-value from 0 to 4 with steps of 1, we ll get 5 points. We form a table and fill in the x-values: We put each x-value into our equation to get the corresponding y-value We note that x and y are always positive, so we sketch the following axes: We plot each point. We connect the dots. Our graph looks like a line (and it is). We can even predict how it will look outside of our plot range. 1 1 3 2 2 5 3 3 7 y 4 4 9 10 8 6 4 2 x 1 2 3 4 5
x y -3 9 Another Graphing Example -2 4 -1 1 Let s start with a simple example: y=x2 with -3 x 3 If we step the x-value from -3 to 3 with steps of 1, we ll get 7 points. We form a table, fill in the x-values, and compute the y-values. We note that y is always positive, so we sketch the following axes: We plot each point and connect the dots. This graph looks quite different from the first. 0 0 1 1 2 4 y 3 9 10 8 6 4 2 x -3 -2 -1 0 1 2 3
Conclusion Functions operate on a number and give a result Functions are reversible Functions can be expressed as a series of points, as a table, as an equation, and as a graph To graph a function: Figure out a good number of x-values to use (based on the domain) Compute the corresponding y-values (using a calculator) Sketch a set of axes and plot the points Connect the dots