Understanding Extreme Wind Speed Measurements from NASA's SMAP L-Band Radiometer
NASA's SMAP (Soil Moisture Active Passive) mission has been collecting data on extreme wind speeds since April 2015 using an L-band radiometer. The measurements provide valuable insights into wind speed frequencies, with a wide range of signals received by the sensor challenging the data analysis. Advanced algorithms are employed to retrieve accurate wind speed and salinity information, with the basis for wind speed retrieval established through detailed analysis and validation against other measurement methods. The L-band radiometer's sensitivity to high wind speeds, lack of saturation, and minimal rain impact contribute to its effectiveness in capturing wind speed data under various conditions.

Uploaded on Sep 29, 2024 | 0 Views
Download Presentation

Please find below an Image/Link to download the presentation.
The content on the website is provided AS IS for your information and personal use only. It may not be sold, licensed, or shared on other websites without obtaining consent from the author. Download presentation by click this link. If you encounter any issues during the download, it is possible that the publisher has removed the file from their server.
E N D
Presentation Transcript
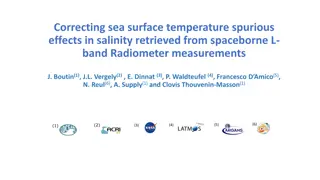
Extreme Wind Speed Measurements from NASA s SMAP L-Band Radiometer Thomas Meissner1, Lucrezia Ricciardulli1, Frank Wentz1, Andrew Manaster1, Charles Sampson2 1Remote Sensing Systems, Santa Rosa, CA, USA 2NRL, Monterey, CA, USA IOVWST Meeting, April 24 26, 2018 Barcelona, Spain T. Meissner, L. Ricciardulli + F. Wentz: BAMS August 2017.
NASA SMAP (Soil Moisture Active + Passive) Taking observations since April 2015 Ocean Products: Sea Surface Salinity + Wind Speed Frequency 1.41 GHz (L-band) o In line with SMOS (ESA) + Aquarius (NASA) Polar Orbit @ altitude: 685 km. 8-day repeat. Local ascending/descending time: 6 PM/AM. Full 360o conical scan views the Earth. 6-meter mesh antenna. 1000 km wide swath. 3-dB (half power) footprint size: 40 km. 2 polarizations: V + H
Signals Received by the SMAP Sensor Challenge: Many sizeable spurious signals other than wind + salinity Sun direct and reflected Antenna (emissive, x-pol) Galaxy & Cosmic direct + reflected SMAP Moon Ionosphere Atmosphere (oxygen) Solar Backscatter Solar Reflection RFI Rough Ocean Surface (Wind) Land/Ice contamination Flat Ocean Surface (Salinity)
Algorithms for SMAP Salinity + Wind Speed There is not enough information in the two SMAP (V-pol/H-pol) channels for simultaneous retrievals of both parameters. Two separate algorithms are needed with different ancillary input. SMAP Antenna Temperatures calibrated + RFI filtered remove spurious signals antenna (emissivity, x-pol), galaxy, cold space, ionosphere, atmosphere, land contamination, Sea-Surface Brightness Temperature ancillary wind speed (WindSat, NCEP) ancillary salinity (HYCOM, FOAM) remove rough surface (wind) signal calculate flat surface TB (Meissner Wentz dielectric constant) flat surface TB wind induced (excess) TB match with model for flat surface TB (Meissner Wentz dielectric constant) match with model function for excess emissivity SMAP Salinity SMAP Wind Speed
Basis for Wind Speed Retrieval Signal at L-Band Wind response = Wind induced (excess) emissivity TB = T B rough T B flat Above 10 m/s: Sea foam Validation: SMAP vs SFMR (resampled) Signal SMAP wind speed (m/s) TB (Kelvin) CAT 1 CAT 5 CAT 3 SFMR wind speed (m/s) resampled to SMAP spatial resolution Very good SMAP-SFMR agreement 10-70 m/s. Accuracy ~ 10% L-band radiometer signal does not saturate at high winds. No rain impact. keeps good sensitivity even at very high wind speeds Wind speed (m/s)
Version 1.0 Release February 2018. Supersedes BETA (V0). 1. Improved flagging for land and sea ice. 2. SST dependence of wind induced emissivity model. Had been neglected in BETA release. In Version 1 we use the same SST dependence as for Aquarius End of Mission (Version 5) salinity algorithm. Steeper slope = lower wind speeds (by about 6%) in cold water (extratropical cyclones) compared to BETA release. Little change in warm water (tropical cyclones) compared to BETA release. 3. Handling of river plumes. 4. Ancillary salinity input.
SMAP versus WindSat Better match with WindSat high winds in Version 1. Validation with oil-platform anemometers (see following talk by L. Ricciardulli)
River Plumes Example: Gulf of Bengal SMAP Wind SMAP Wind Version 0 (BETA): Version 1: Uses HYCOM as ancillary salinity input. Uses SMAP 8-day salinity average as ancillary salinity input. Misses strong freshening from Ganges outflow. Captures strong freshening from Ganges outflow. ancillary salinity ancillary salinity Results in unrealistic high wind speeds. Realistic wind speeds. Rain freshening? This is not an issue for high winds (> 15 m/s) in rain, because the upper ocean layer mixes.
Algorithms for SMAP Salinity + Wind Speed Algorithms for SMAP Salinity + Wind Speed We cannot use the SMAP salinity directly in the SMAP wind retrieval. We cannot use the SMAP salinity directly in the SMAP wind retrieval. However, it is possible to use an 8 However, it is possible to use an 8- -day averaged SMAP salinity in the SMAP wind retrievals. day averaged SMAP salinity in the SMAP wind retrievals. Salinity changes very little within 8 days. Wind speed is very variable. Salinity changes very little within 8 days. Wind speed is very variable. SMAP Antenna Temperatures calibrated + RFI filtered remove spurious signals antenna (emissivity, x-pol), galaxy, cold space, ionosphere, atmosphere, land contamination, Sea-Surface Brightness Temperature ancillary wind speed (WindSat, NCEP) ancillary salinity HYCOM 8-day average remove rough surface (wind) signal calculate flat surface TB (Meissner Wentz dielectric constant) flat surface TB wind induced (excess) TB match with model for flat surface TB (Meissner Wentz dielectric constant) match with model function for excess emissivity SMAP Salinity SMAP Wind Speed
Version 1.0 Release Processing Streams 1. Near-Real Time (NRT). Aimed for tropical cyclone forecast community. As soon as SMAP measurements (antenna temperatures) become available. Currently: About 3-hours latency. Plan to further cut it to less than 2 hours using shortcut in SMAP ephemeris processing. Uses static climatology ancillary salinity input (salinity, atmosphere, ) Masks river plumes (Amazon, Ganges, Congo, ) = areas with large salinity variations. Final product. Back processed about twice a months. Uses high-quality dynamic ancillary input. E.g.: SMAP 8-day salinity average. Wind speed range: 12 70 m/s 2.
Data Products and Distribution @ RSS www.remss.com/missions/smap/ Level 3 daily maps Separate for ascending (PM) and ascending (AM) swaths. Spatial sampling: 0.25o. Actual spatial resolution: 40 km. netCDF4. NRT and Final. Storm intensity + size for TC TC Images. ASCII files containing intensity and the 17.5 m/s, 25 m/s, 33 m/s radii. ingested into the Automated Tropical Cyclone Forecast (ATCF) system used by NRL (US Navy) + by the Joint Typhoon Warning Center. We plan to extend it to extra-tropical storms. Hurricane Irma Sep 5, 2017 IRMA NORU
Storm Intensity Evolution vs Best Track Data Max intensity of satellite winds compared to 10-min sustained winds from Best Track SMAP consistent with BT max wind evolution ASCAT saturates above 35 m/s in most instances. Rapid intensification captured by SMAP Hurricane MARIA (Cat. 4 > 59 m/s) Super-Hurricane IRMA (Cat. 5 > 70 m/s)
Storm Size Evolution vs Best Track Data SMAP and ASCAT both capture storm size at 34kn and 50kn At 64kn, SMAP consistently captures storm size ASCAT often captures the storm size at 64kn, but not consistently due to its reduced sensitivity. Hurricane MARIA, 64kn radius NE quadrant (33 m/s) Hurricane MARIA, 34kn radius NE quadrant (17 m/s) 10
NORU ASCAT did not reach 64kn More 64kn Radii for sample storms SMAP, ASCAT vs Best track data MARIA IRMA 11
Summary RSS SMAP Version 1 released Feb 2018 Near Real Time and Final processing. Ancillary salinity input becomes important in river plume areas, corrects winds. Good match with WindSat in extratropical cyclones. Validated against SFMR in TC. Very good agreement with Best Track data of intensity and size of TC. Realistic assessment of Rapid Intensification of TC between 12 - 70 m/s. We plan to use SMAP winds for validation and geophysical model function tuning at high winds (CYGNSS, ASCAT, ). o Much easier to use than collocating with SFMR.

")


")